Paiute vs West Indian 12th Grade, No Diploma
COMPARE
Paiute
West Indian
12th Grade, No Diploma
12th Grade, No Diploma Comparison
Paiute
West Indians
88.7%
12TH GRADE, NO DIPLOMA
0.0/ 100
METRIC RATING
283rd/ 347
METRIC RANK
89.3%
12TH GRADE, NO DIPLOMA
0.2/ 100
METRIC RATING
267th/ 347
METRIC RANK
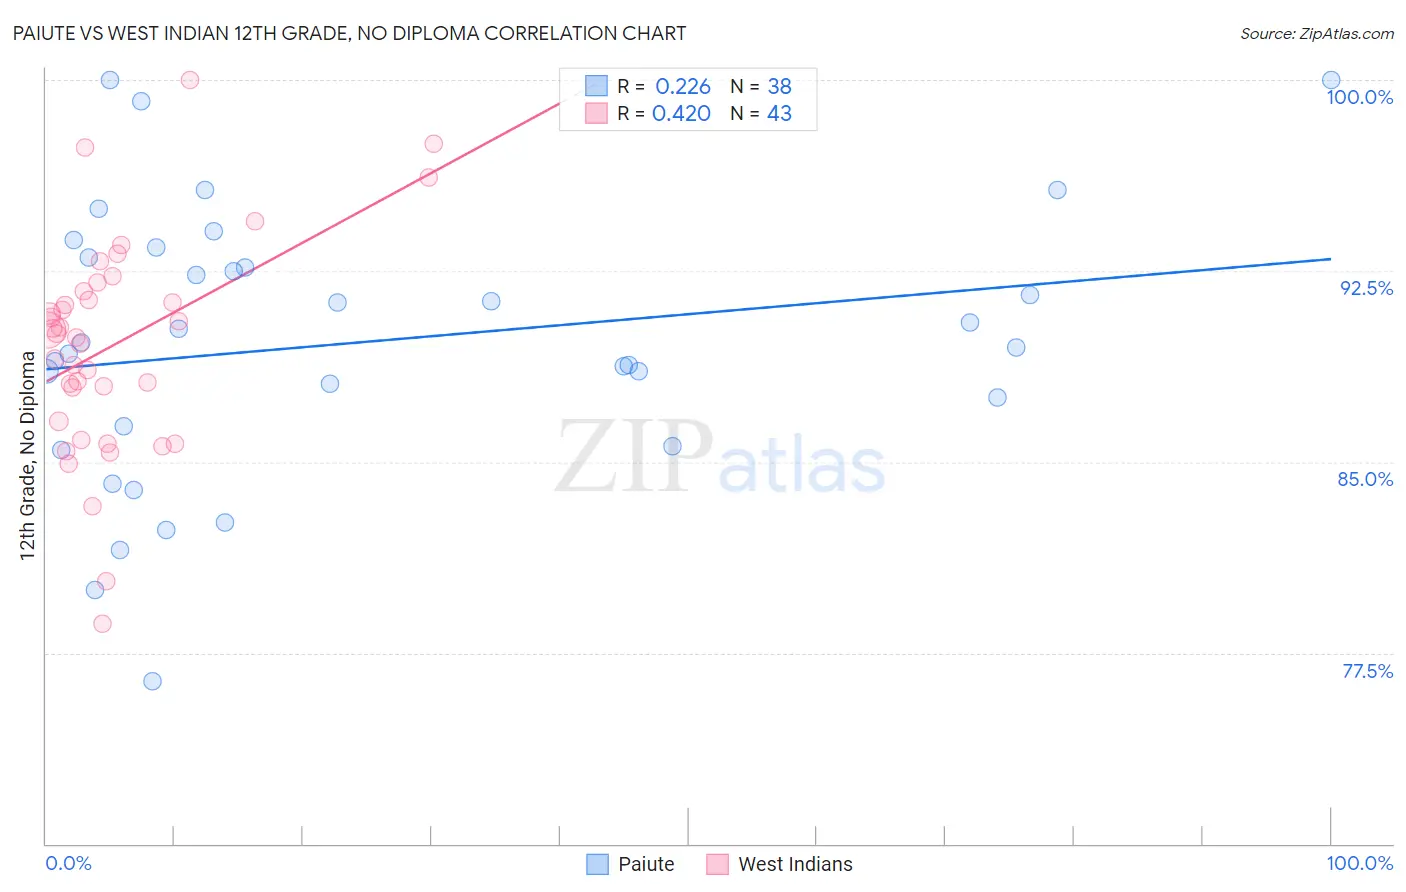
Paiute vs West Indian 12th Grade, No Diploma Correlation Chart
The statistical analysis conducted on geographies consisting of 58,404,248 people shows a weak positive correlation between the proportion of Paiute and percentage of population with at least 12th grade (no diploma) education in the United States with a correlation coefficient (R) of 0.226 and weighted average of 88.7%. Similarly, the statistical analysis conducted on geographies consisting of 254,059,006 people shows a moderate positive correlation between the proportion of West Indians and percentage of population with at least 12th grade (no diploma) education in the United States with a correlation coefficient (R) of 0.420 and weighted average of 89.3%, a difference of 0.76%.
12th Grade, No Diploma Correlation Summary
| Measurement | Paiute | West Indian |
| Minimum | 76.4% | 78.6% |
| Maximum | 100.0% | 100.0% |
| Range | 23.6% | 21.4% |
| Mean | 89.7% | 89.6% |
| Median | 89.6% | 90.0% |
| Interquartile 25% (IQ1) | 86.4% | 86.6% |
| Interquartile 75% (IQ3) | 93.0% | 91.7% |
| Interquartile Range (IQR) | 6.6% | 5.1% |
| Standard Deviation (Sample) | 5.4% | 4.2% |
| Standard Deviation (Population) | 5.3% | 4.2% |
Demographics Similar to Paiute and West Indians by 12th Grade, No Diploma
In terms of 12th grade, no diploma, the demographic groups most similar to Paiute are Pennsylvania German (88.7%, a difference of 0.010%), Indonesian (88.6%, a difference of 0.030%), Immigrants from Vietnam (88.7%, a difference of 0.060%), Cuban (88.9%, a difference of 0.22%), and Immigrants from Laos (88.9%, a difference of 0.23%). Similarly, the demographic groups most similar to West Indians are Seminole (89.4%, a difference of 0.010%), Immigrants from Trinidad and Tobago (89.3%, a difference of 0.020%), U.S. Virgin Islander (89.3%, a difference of 0.060%), Trinidadian and Tobagonian (89.4%, a difference of 0.080%), and Bangladeshi (89.3%, a difference of 0.10%).
| Demographics | Rating | Rank | 12th Grade, No Diploma |
| Trinidadians and Tobagonians | 0.2 /100 | #265 | Tragic 89.4% |
| Seminole | 0.2 /100 | #266 | Tragic 89.4% |
| West Indians | 0.2 /100 | #267 | Tragic 89.3% |
| Immigrants | Trinidad and Tobago | 0.1 /100 | #268 | Tragic 89.3% |
| U.S. Virgin Islanders | 0.1 /100 | #269 | Tragic 89.3% |
| Bangladeshis | 0.1 /100 | #270 | Tragic 89.3% |
| Blacks/African Americans | 0.1 /100 | #271 | Tragic 89.3% |
| Malaysians | 0.1 /100 | #272 | Tragic 89.2% |
| Barbadians | 0.1 /100 | #273 | Tragic 89.1% |
| Cajuns | 0.1 /100 | #274 | Tragic 89.1% |
| Immigrants | Congo | 0.1 /100 | #275 | Tragic 89.0% |
| Ute | 0.1 /100 | #276 | Tragic 89.0% |
| Immigrants | Barbados | 0.0 /100 | #277 | Tragic 89.0% |
| Immigrants | St. Vincent and the Grenadines | 0.0 /100 | #278 | Tragic 88.9% |
| Immigrants | Laos | 0.0 /100 | #279 | Tragic 88.9% |
| Immigrants | Burma/Myanmar | 0.0 /100 | #280 | Tragic 88.9% |
| Cubans | 0.0 /100 | #281 | Tragic 88.9% |
| Immigrants | Vietnam | 0.0 /100 | #282 | Tragic 88.7% |
| Paiute | 0.0 /100 | #283 | Tragic 88.7% |
| Pennsylvania Germans | 0.0 /100 | #284 | Tragic 88.7% |
| Indonesians | 0.0 /100 | #285 | Tragic 88.6% |