Paiute vs Finnish 2 or more Vehicles in Household
COMPARE
Paiute
Finnish
2 or more Vehicles in Household
2 or more Vehicles in Household Comparison
Paiute
Finns
55.8%
2 OR MORE VEHICLES IN HOUSEHOLD
68.0/ 100
METRIC RATING
159th/ 347
METRIC RANK
60.3%
2 OR MORE VEHICLES IN HOUSEHOLD
100.0/ 100
METRIC RATING
30th/ 347
METRIC RANK
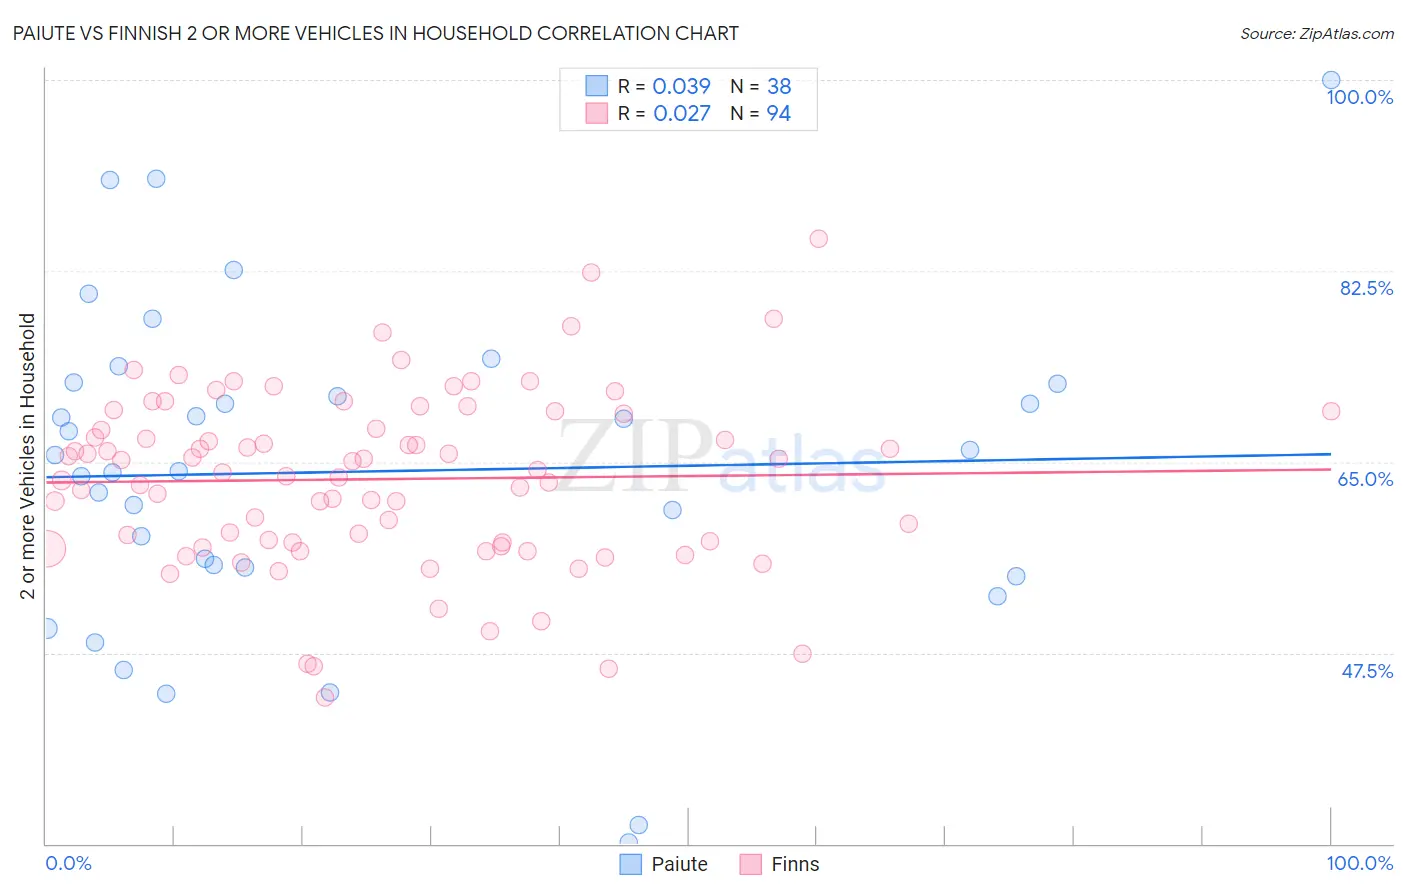
Paiute vs Finnish 2 or more Vehicles in Household Correlation Chart
The statistical analysis conducted on geographies consisting of 58,398,670 people shows no correlation between the proportion of Paiute and percentage of households with 2 or more vehicles available in the United States with a correlation coefficient (R) of 0.039 and weighted average of 55.8%. Similarly, the statistical analysis conducted on geographies consisting of 404,547,862 people shows no correlation between the proportion of Finns and percentage of households with 2 or more vehicles available in the United States with a correlation coefficient (R) of 0.027 and weighted average of 60.3%, a difference of 8.2%.
2 or more Vehicles in Household Correlation Summary
| Measurement | Paiute | Finnish |
| Minimum | 30.2% | 43.4% |
| Maximum | 100.0% | 85.5% |
| Range | 69.8% | 42.1% |
| Mean | 64.1% | 63.4% |
| Median | 64.9% | 64.1% |
| Interquartile 25% (IQ1) | 55.3% | 57.6% |
| Interquartile 75% (IQ3) | 72.1% | 69.4% |
| Interquartile Range (IQR) | 16.8% | 11.8% |
| Standard Deviation (Sample) | 15.1% | 8.0% |
| Standard Deviation (Population) | 14.9% | 8.0% |
Similar Demographics by 2 or more Vehicles in Household
Demographics Similar to Paiute by 2 or more Vehicles in Household
In terms of 2 or more vehicles in household, the demographic groups most similar to Paiute are Tlingit-Haida (55.8%, a difference of 0.020%), Crow (55.7%, a difference of 0.050%), Immigrants from Kuwait (55.8%, a difference of 0.10%), Immigrants from Lithuania (55.8%, a difference of 0.11%), and Immigrants from Venezuela (55.8%, a difference of 0.12%).
| Demographics | Rating | Rank | 2 or more Vehicles in Household |
| Immigrants | Pakistan | 78.1 /100 | #152 | Good 56.1% |
| Lumbee | 71.9 /100 | #153 | Good 55.9% |
| Ukrainians | 70.8 /100 | #154 | Good 55.8% |
| Immigrants | Venezuela | 70.7 /100 | #155 | Good 55.8% |
| Immigrants | Lithuania | 70.4 /100 | #156 | Good 55.8% |
| Immigrants | Kuwait | 70.2 /100 | #157 | Good 55.8% |
| Tlingit-Haida | 68.5 /100 | #158 | Good 55.8% |
| Paiute | 68.0 /100 | #159 | Good 55.8% |
| Crow | 67.0 /100 | #160 | Good 55.7% |
| Colville | 61.1 /100 | #161 | Good 55.6% |
| German Russians | 60.9 /100 | #162 | Good 55.6% |
| Immigrants | Zimbabwe | 60.2 /100 | #163 | Good 55.6% |
| Dutch West Indians | 59.8 /100 | #164 | Average 55.6% |
| Immigrants | El Salvador | 59.4 /100 | #165 | Average 55.6% |
| Immigrants | Sri Lanka | 58.3 /100 | #166 | Average 55.5% |
Demographics Similar to Finns by 2 or more Vehicles in Household
In terms of 2 or more vehicles in household, the demographic groups most similar to Finns are Spanish American Indian (60.3%, a difference of 0.030%), Hawaiian (60.4%, a difference of 0.13%), Arapaho (60.2%, a difference of 0.13%), Immigrants from Mexico (60.2%, a difference of 0.19%), and Guamanian/Chamorro (60.5%, a difference of 0.24%).
| Demographics | Rating | Rank | 2 or more Vehicles in Household |
| Scotch-Irish | 100.0 /100 | #23 | Exceptional 60.9% |
| Immigrants | Vietnam | 100.0 /100 | #24 | Exceptional 60.9% |
| Whites/Caucasians | 100.0 /100 | #25 | Exceptional 60.8% |
| Welsh | 100.0 /100 | #26 | Exceptional 60.8% |
| Assyrians/Chaldeans/Syriacs | 100.0 /100 | #27 | Exceptional 60.5% |
| Guamanians/Chamorros | 100.0 /100 | #28 | Exceptional 60.5% |
| Hawaiians | 100.0 /100 | #29 | Exceptional 60.4% |
| Finns | 100.0 /100 | #30 | Exceptional 60.3% |
| Spanish American Indians | 100.0 /100 | #31 | Exceptional 60.3% |
| Arapaho | 100.0 /100 | #32 | Exceptional 60.2% |
| Immigrants | Mexico | 100.0 /100 | #33 | Exceptional 60.2% |
| Spanish | 100.0 /100 | #34 | Exceptional 60.2% |
| Immigrants | Philippines | 100.0 /100 | #35 | Exceptional 60.1% |
| Chinese | 100.0 /100 | #36 | Exceptional 60.1% |
| Irish | 100.0 /100 | #37 | Exceptional 60.1% |