Paiute vs West Indian In Labor Force | Age 25-29
COMPARE
Paiute
West Indian
In Labor Force | Age 25-29
In Labor Force | Age 25-29 Comparison
Paiute
West Indians
78.1%
IN LABOR FORCE | AGE 25-29
0.0/ 100
METRIC RATING
340th/ 347
METRIC RANK
83.5%
IN LABOR FORCE | AGE 25-29
0.1/ 100
METRIC RATING
263rd/ 347
METRIC RANK
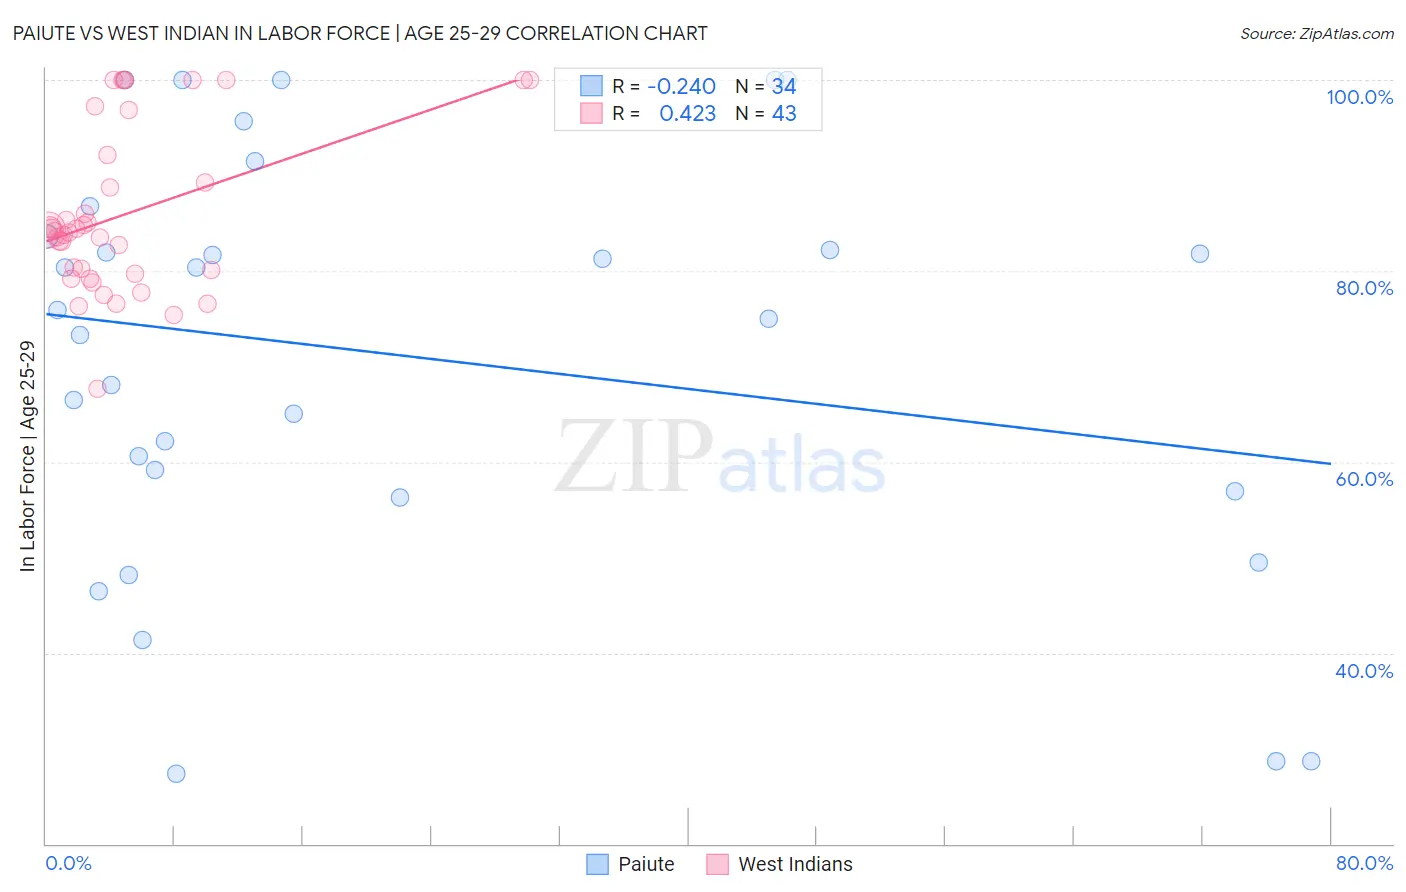
Paiute vs West Indian In Labor Force | Age 25-29 Correlation Chart
The statistical analysis conducted on geographies consisting of 58,387,082 people shows a weak negative correlation between the proportion of Paiute and labor force participation rate among population between the ages 25 and 29 in the United States with a correlation coefficient (R) of -0.240 and weighted average of 78.1%. Similarly, the statistical analysis conducted on geographies consisting of 254,002,174 people shows a moderate positive correlation between the proportion of West Indians and labor force participation rate among population between the ages 25 and 29 in the United States with a correlation coefficient (R) of 0.423 and weighted average of 83.5%, a difference of 6.9%.
In Labor Force | Age 25-29 Correlation Summary
| Measurement | Paiute | West Indian |
| Minimum | 27.3% | 67.7% |
| Maximum | 100.0% | 100.0% |
| Range | 72.7% | 32.3% |
| Mean | 71.1% | 86.0% |
| Median | 75.5% | 84.2% |
| Interquartile 25% (IQ1) | 56.9% | 79.7% |
| Interquartile 75% (IQ3) | 83.6% | 92.1% |
| Interquartile Range (IQR) | 26.7% | 12.4% |
| Standard Deviation (Sample) | 21.5% | 8.6% |
| Standard Deviation (Population) | 21.2% | 8.5% |
Similar Demographics by In Labor Force | Age 25-29
Demographics Similar to Paiute by In Labor Force | Age 25-29
In terms of in labor force | age 25-29, the demographic groups most similar to Paiute are Immigrants from Yemen (78.2%, a difference of 0.16%), Lumbee (78.3%, a difference of 0.28%), Crow (78.6%, a difference of 0.65%), Tohono O'odham (77.5%, a difference of 0.78%), and Pueblo (77.5%, a difference of 0.80%).
| Demographics | Rating | Rank | In Labor Force | Age 25-29 |
| Sioux | 0.0 /100 | #333 | Tragic 79.7% |
| Yuman | 0.0 /100 | #334 | Tragic 79.3% |
| Natives/Alaskans | 0.0 /100 | #335 | Tragic 79.3% |
| Apache | 0.0 /100 | #336 | Tragic 79.2% |
| Crow | 0.0 /100 | #337 | Tragic 78.6% |
| Lumbee | 0.0 /100 | #338 | Tragic 78.3% |
| Immigrants | Yemen | 0.0 /100 | #339 | Tragic 78.2% |
| Paiute | 0.0 /100 | #340 | Tragic 78.1% |
| Tohono O'odham | 0.0 /100 | #341 | Tragic 77.5% |
| Pueblo | 0.0 /100 | #342 | Tragic 77.5% |
| Arapaho | 0.0 /100 | #343 | Tragic 76.6% |
| Hopi | 0.0 /100 | #344 | Tragic 76.5% |
| Navajo | 0.0 /100 | #345 | Tragic 74.6% |
| Pima | 0.0 /100 | #346 | Tragic 74.3% |
| Yup'ik | 0.0 /100 | #347 | Tragic 73.1% |
Demographics Similar to West Indians by In Labor Force | Age 25-29
In terms of in labor force | age 25-29, the demographic groups most similar to West Indians are Immigrants from Fiji (83.6%, a difference of 0.040%), Puget Sound Salish (83.5%, a difference of 0.060%), Cuban (83.5%, a difference of 0.060%), Aleut (83.4%, a difference of 0.10%), and Immigrants from Bahamas (83.6%, a difference of 0.11%).
| Demographics | Rating | Rank | In Labor Force | Age 25-29 |
| Immigrants | Haiti | 0.2 /100 | #256 | Tragic 83.7% |
| Delaware | 0.2 /100 | #257 | Tragic 83.7% |
| Immigrants | Guatemala | 0.1 /100 | #258 | Tragic 83.6% |
| Spanish | 0.1 /100 | #259 | Tragic 83.6% |
| Immigrants | Bahamas | 0.1 /100 | #260 | Tragic 83.6% |
| Pennsylvania Germans | 0.1 /100 | #261 | Tragic 83.6% |
| Immigrants | Fiji | 0.1 /100 | #262 | Tragic 83.6% |
| West Indians | 0.1 /100 | #263 | Tragic 83.5% |
| Puget Sound Salish | 0.1 /100 | #264 | Tragic 83.5% |
| Cubans | 0.1 /100 | #265 | Tragic 83.5% |
| Aleuts | 0.0 /100 | #266 | Tragic 83.4% |
| Spanish Americans | 0.0 /100 | #267 | Tragic 83.4% |
| Immigrants | Lebanon | 0.0 /100 | #268 | Tragic 83.4% |
| Immigrants | Barbados | 0.0 /100 | #269 | Tragic 83.4% |
| Basques | 0.0 /100 | #270 | Tragic 83.4% |