Immigrants from Nigeria vs West Indian 2 or more Vehicles in Household
COMPARE
Immigrants from Nigeria
West Indian
2 or more Vehicles in Household
2 or more Vehicles in Household Comparison
Immigrants from Nigeria
West Indians
52.9%
2 OR MORE VEHICLES IN HOUSEHOLD
1.2/ 100
METRIC RATING
246th/ 347
METRIC RANK
41.3%
2 OR MORE VEHICLES IN HOUSEHOLD
0.0/ 100
METRIC RATING
331st/ 347
METRIC RANK
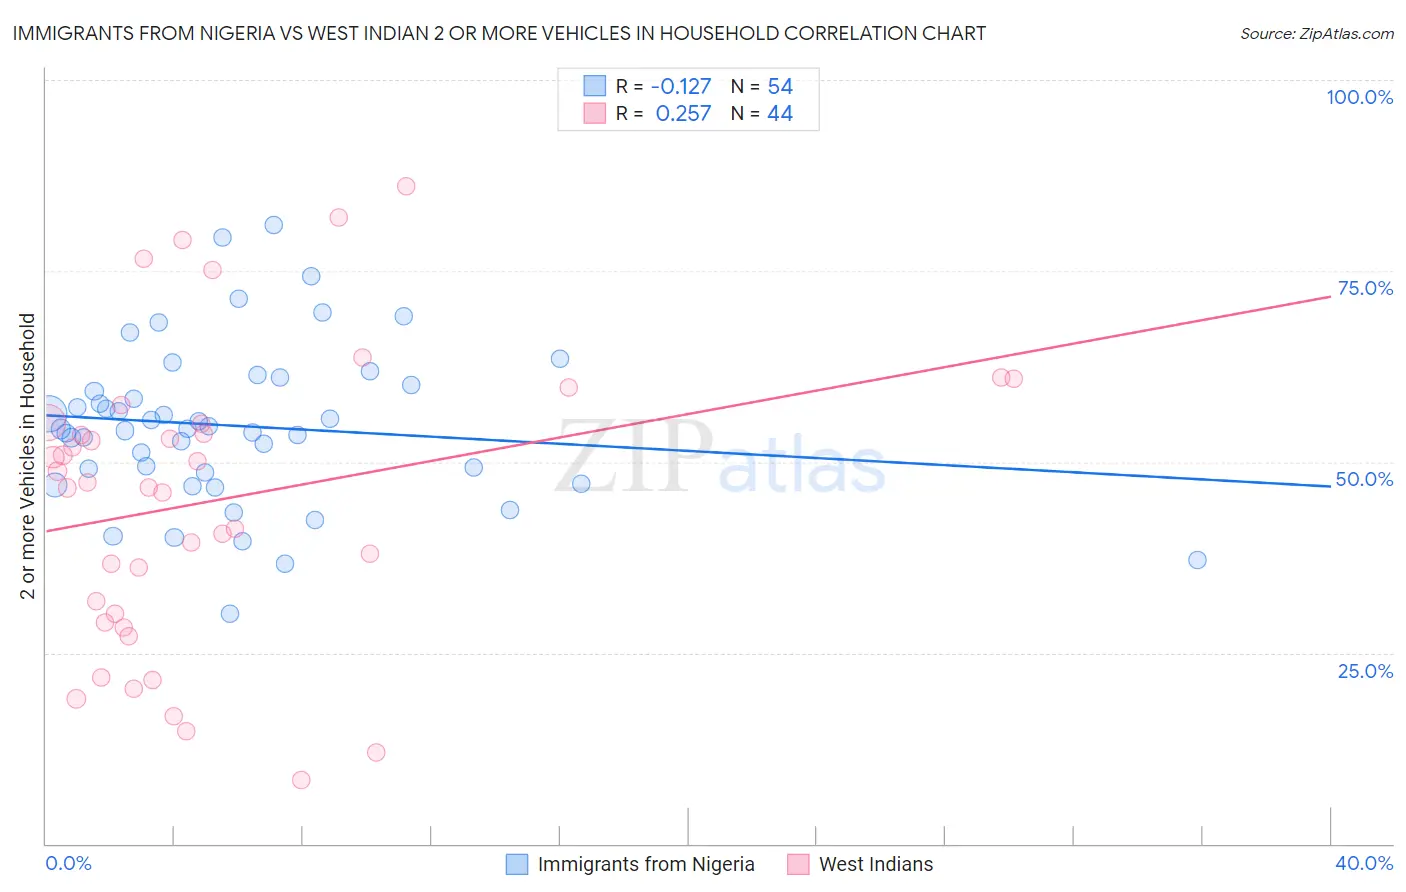
Immigrants from Nigeria vs West Indian 2 or more Vehicles in Household Correlation Chart
The statistical analysis conducted on geographies consisting of 283,313,070 people shows a poor negative correlation between the proportion of Immigrants from Nigeria and percentage of households with 2 or more vehicles available in the United States with a correlation coefficient (R) of -0.127 and weighted average of 52.9%. Similarly, the statistical analysis conducted on geographies consisting of 253,888,227 people shows a weak positive correlation between the proportion of West Indians and percentage of households with 2 or more vehicles available in the United States with a correlation coefficient (R) of 0.257 and weighted average of 41.3%, a difference of 28.2%.
2 or more Vehicles in Household Correlation Summary
| Measurement | Immigrants from Nigeria | West Indian |
| Minimum | 30.1% | 8.3% |
| Maximum | 81.0% | 86.1% |
| Range | 50.9% | 77.8% |
| Mean | 54.7% | 44.9% |
| Median | 54.3% | 47.0% |
| Interquartile 25% (IQ1) | 48.5% | 29.6% |
| Interquartile 75% (IQ3) | 60.0% | 55.1% |
| Interquartile Range (IQR) | 11.5% | 25.5% |
| Standard Deviation (Sample) | 10.5% | 19.3% |
| Standard Deviation (Population) | 10.4% | 19.1% |
Similar Demographics by 2 or more Vehicles in Household
Demographics Similar to Immigrants from Nigeria by 2 or more Vehicles in Household
In terms of 2 or more vehicles in household, the demographic groups most similar to Immigrants from Nigeria are Sierra Leonean (52.9%, a difference of 0.030%), Colombian (52.9%, a difference of 0.15%), Immigrants from Ethiopia (53.0%, a difference of 0.20%), Immigrants from Brazil (52.8%, a difference of 0.20%), and Mongolian (52.8%, a difference of 0.21%).
| Demographics | Rating | Rank | 2 or more Vehicles in Household |
| Cambodians | 2.3 /100 | #239 | Tragic 53.3% |
| Immigrants | Europe | 2.1 /100 | #240 | Tragic 53.2% |
| Immigrants | Sierra Leone | 2.1 /100 | #241 | Tragic 53.2% |
| Immigrants | Eastern Asia | 2.1 /100 | #242 | Tragic 53.2% |
| Ethiopians | 1.7 /100 | #243 | Tragic 53.1% |
| Indians (Asian) | 1.7 /100 | #244 | Tragic 53.1% |
| Immigrants | Ethiopia | 1.5 /100 | #245 | Tragic 53.0% |
| Immigrants | Nigeria | 1.2 /100 | #246 | Tragic 52.9% |
| Sierra Leoneans | 1.2 /100 | #247 | Tragic 52.9% |
| Colombians | 1.1 /100 | #248 | Tragic 52.9% |
| Immigrants | Brazil | 1.0 /100 | #249 | Tragic 52.8% |
| Mongolians | 1.0 /100 | #250 | Tragic 52.8% |
| Immigrants | Sudan | 1.0 /100 | #251 | Tragic 52.8% |
| Immigrants | Portugal | 1.0 /100 | #252 | Tragic 52.8% |
| Nigerians | 0.9 /100 | #253 | Tragic 52.8% |
Demographics Similar to West Indians by 2 or more Vehicles in Household
In terms of 2 or more vehicles in household, the demographic groups most similar to West Indians are Immigrants from Dominica (41.6%, a difference of 0.85%), Trinidadian and Tobagonian (40.9%, a difference of 0.98%), Ecuadorian (42.0%, a difference of 1.7%), Immigrants from Ecuador (40.5%, a difference of 1.9%), and Immigrants from Trinidad and Tobago (40.3%, a difference of 2.5%).
| Demographics | Rating | Rank | 2 or more Vehicles in Household |
| Immigrants | Cabo Verde | 0.0 /100 | #324 | Tragic 43.3% |
| Immigrants | West Indies | 0.0 /100 | #325 | Tragic 43.1% |
| Immigrants | Senegal | 0.0 /100 | #326 | Tragic 43.0% |
| Immigrants | Yemen | 0.0 /100 | #327 | Tragic 42.8% |
| Inupiat | 0.0 /100 | #328 | Tragic 42.6% |
| Ecuadorians | 0.0 /100 | #329 | Tragic 42.0% |
| Immigrants | Dominica | 0.0 /100 | #330 | Tragic 41.6% |
| West Indians | 0.0 /100 | #331 | Tragic 41.3% |
| Trinidadians and Tobagonians | 0.0 /100 | #332 | Tragic 40.9% |
| Immigrants | Ecuador | 0.0 /100 | #333 | Tragic 40.5% |
| Immigrants | Trinidad and Tobago | 0.0 /100 | #334 | Tragic 40.3% |
| Immigrants | Bangladesh | 0.0 /100 | #335 | Tragic 38.8% |
| Vietnamese | 0.0 /100 | #336 | Tragic 38.5% |
| Barbadians | 0.0 /100 | #337 | Tragic 38.3% |
| Immigrants | Uzbekistan | 0.0 /100 | #338 | Tragic 37.9% |