Paiute vs Russian 2 or more Vehicles in Household
COMPARE
Paiute
Russian
2 or more Vehicles in Household
2 or more Vehicles in Household Comparison
Paiute
Russians
55.8%
2 OR MORE VEHICLES IN HOUSEHOLD
68.0/ 100
METRIC RATING
159th/ 347
METRIC RANK
54.8%
2 OR MORE VEHICLES IN HOUSEHOLD
26.3/ 100
METRIC RATING
190th/ 347
METRIC RANK
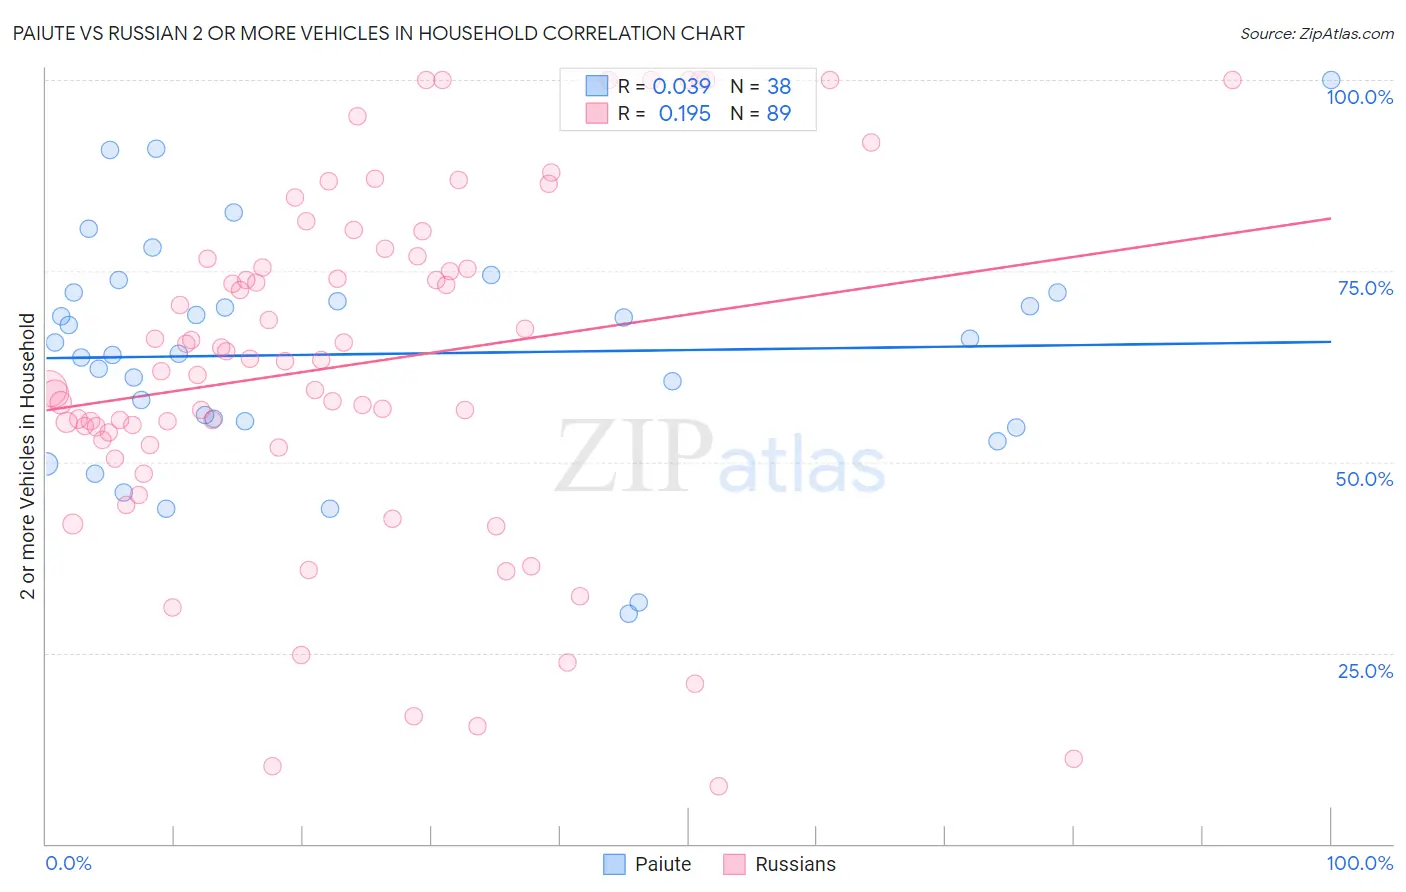
Paiute vs Russian 2 or more Vehicles in Household Correlation Chart
The statistical analysis conducted on geographies consisting of 58,398,670 people shows no correlation between the proportion of Paiute and percentage of households with 2 or more vehicles available in the United States with a correlation coefficient (R) of 0.039 and weighted average of 55.8%. Similarly, the statistical analysis conducted on geographies consisting of 511,789,622 people shows a poor positive correlation between the proportion of Russians and percentage of households with 2 or more vehicles available in the United States with a correlation coefficient (R) of 0.195 and weighted average of 54.8%, a difference of 1.8%.
2 or more Vehicles in Household Correlation Summary
| Measurement | Paiute | Russian |
| Minimum | 30.2% | 7.6% |
| Maximum | 100.0% | 100.0% |
| Range | 69.8% | 92.4% |
| Mean | 64.1% | 62.7% |
| Median | 64.9% | 63.1% |
| Interquartile 25% (IQ1) | 55.3% | 52.5% |
| Interquartile 75% (IQ3) | 72.1% | 76.7% |
| Interquartile Range (IQR) | 16.8% | 24.2% |
| Standard Deviation (Sample) | 15.1% | 22.8% |
| Standard Deviation (Population) | 14.9% | 22.7% |
Similar Demographics by 2 or more Vehicles in Household
Demographics Similar to Paiute by 2 or more Vehicles in Household
In terms of 2 or more vehicles in household, the demographic groups most similar to Paiute are Tlingit-Haida (55.8%, a difference of 0.020%), Crow (55.7%, a difference of 0.050%), Immigrants from Kuwait (55.8%, a difference of 0.10%), Immigrants from Lithuania (55.8%, a difference of 0.11%), and Immigrants from Venezuela (55.8%, a difference of 0.12%).
| Demographics | Rating | Rank | 2 or more Vehicles in Household |
| Immigrants | Pakistan | 78.1 /100 | #152 | Good 56.1% |
| Lumbee | 71.9 /100 | #153 | Good 55.9% |
| Ukrainians | 70.8 /100 | #154 | Good 55.8% |
| Immigrants | Venezuela | 70.7 /100 | #155 | Good 55.8% |
| Immigrants | Lithuania | 70.4 /100 | #156 | Good 55.8% |
| Immigrants | Kuwait | 70.2 /100 | #157 | Good 55.8% |
| Tlingit-Haida | 68.5 /100 | #158 | Good 55.8% |
| Paiute | 68.0 /100 | #159 | Good 55.8% |
| Crow | 67.0 /100 | #160 | Good 55.7% |
| Colville | 61.1 /100 | #161 | Good 55.6% |
| German Russians | 60.9 /100 | #162 | Good 55.6% |
| Immigrants | Zimbabwe | 60.2 /100 | #163 | Good 55.6% |
| Dutch West Indians | 59.8 /100 | #164 | Average 55.6% |
| Immigrants | El Salvador | 59.4 /100 | #165 | Average 55.6% |
| Immigrants | Sri Lanka | 58.3 /100 | #166 | Average 55.5% |
Demographics Similar to Russians by 2 or more Vehicles in Household
In terms of 2 or more vehicles in household, the demographic groups most similar to Russians are Eastern European (54.8%, a difference of 0.060%), Immigrants (54.7%, a difference of 0.070%), Immigrants from Romania (54.7%, a difference of 0.13%), Immigrants from Japan (54.7%, a difference of 0.16%), and Central American (54.7%, a difference of 0.18%).
| Demographics | Rating | Rank | 2 or more Vehicles in Household |
| Immigrants | Cameroon | 37.3 /100 | #183 | Fair 55.1% |
| Apache | 36.7 /100 | #184 | Fair 55.1% |
| Arabs | 35.9 /100 | #185 | Fair 55.0% |
| Peruvians | 33.7 /100 | #186 | Fair 55.0% |
| Immigrants | Uganda | 33.4 /100 | #187 | Fair 55.0% |
| Marshallese | 30.5 /100 | #188 | Fair 54.9% |
| Eastern Europeans | 27.5 /100 | #189 | Fair 54.8% |
| Russians | 26.3 /100 | #190 | Fair 54.8% |
| Immigrants | Immigrants | 25.0 /100 | #191 | Fair 54.7% |
| Immigrants | Romania | 23.8 /100 | #192 | Fair 54.7% |
| Immigrants | Japan | 23.4 /100 | #193 | Fair 54.7% |
| Central Americans | 23.0 /100 | #194 | Fair 54.7% |
| Iroquois | 22.6 /100 | #195 | Fair 54.7% |
| Immigrants | Poland | 19.3 /100 | #196 | Poor 54.6% |
| Argentineans | 17.5 /100 | #197 | Poor 54.5% |