Uruguayan vs West Indian 2 or more Vehicles in Household
COMPARE
Uruguayan
West Indian
2 or more Vehicles in Household
2 or more Vehicles in Household Comparison
Uruguayans
West Indians
52.7%
2 OR MORE VEHICLES IN HOUSEHOLD
0.7/ 100
METRIC RATING
255th/ 347
METRIC RANK
41.3%
2 OR MORE VEHICLES IN HOUSEHOLD
0.0/ 100
METRIC RATING
331st/ 347
METRIC RANK
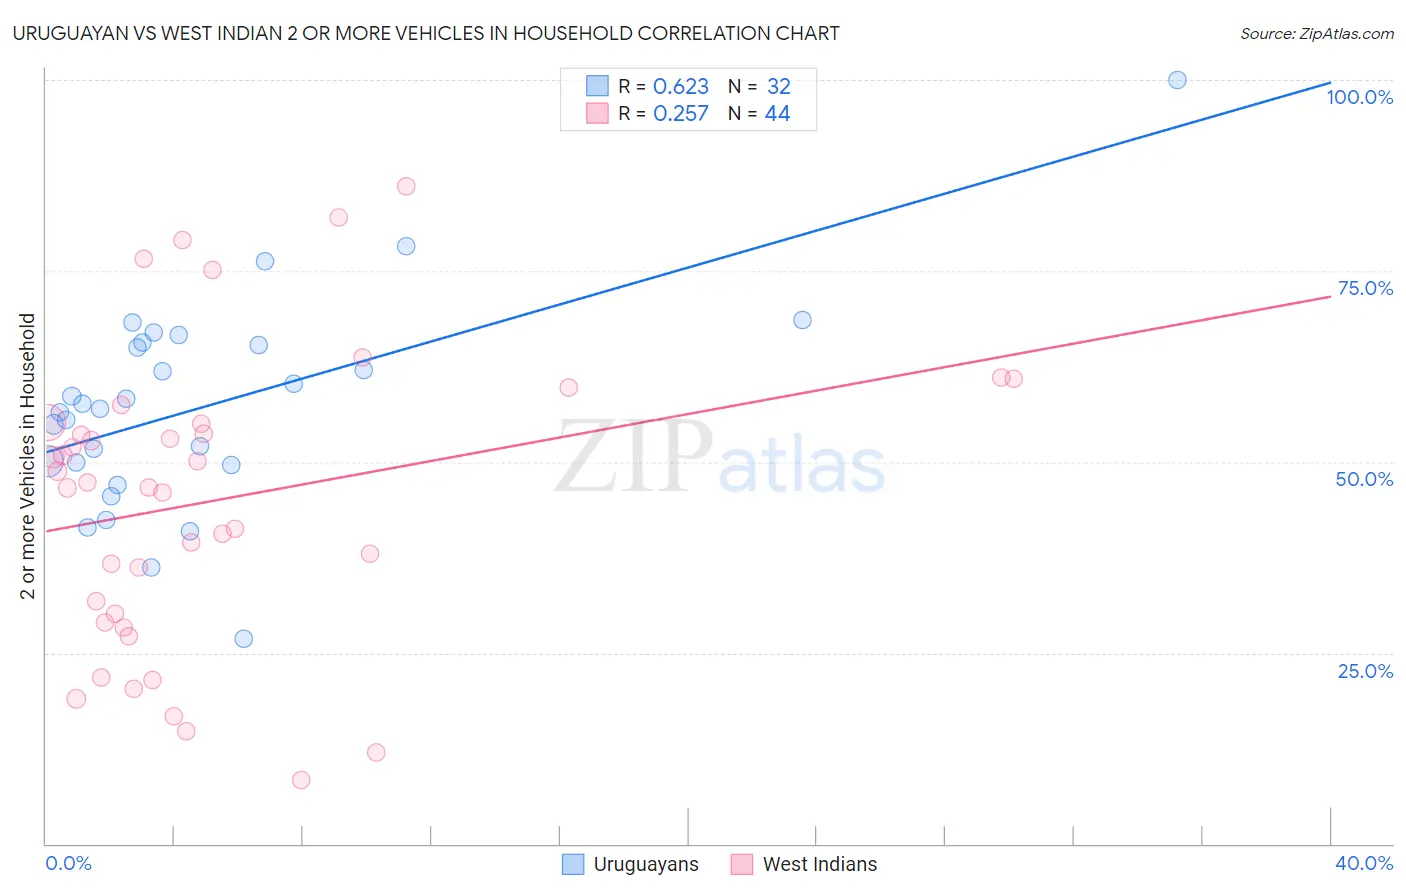
Uruguayan vs West Indian 2 or more Vehicles in Household Correlation Chart
The statistical analysis conducted on geographies consisting of 144,759,773 people shows a significant positive correlation between the proportion of Uruguayans and percentage of households with 2 or more vehicles available in the United States with a correlation coefficient (R) of 0.623 and weighted average of 52.7%. Similarly, the statistical analysis conducted on geographies consisting of 253,888,227 people shows a weak positive correlation between the proportion of West Indians and percentage of households with 2 or more vehicles available in the United States with a correlation coefficient (R) of 0.257 and weighted average of 41.3%, a difference of 27.6%.
2 or more Vehicles in Household Correlation Summary
| Measurement | Uruguayan | West Indian |
| Minimum | 26.8% | 8.3% |
| Maximum | 100.0% | 86.1% |
| Range | 73.2% | 77.8% |
| Mean | 57.4% | 44.9% |
| Median | 57.3% | 47.0% |
| Interquartile 25% (IQ1) | 49.8% | 29.6% |
| Interquartile 75% (IQ3) | 65.5% | 55.1% |
| Interquartile Range (IQR) | 15.7% | 25.5% |
| Standard Deviation (Sample) | 13.8% | 19.3% |
| Standard Deviation (Population) | 13.6% | 19.1% |
Similar Demographics by 2 or more Vehicles in Household
Demographics Similar to Uruguayans by 2 or more Vehicles in Household
In terms of 2 or more vehicles in household, the demographic groups most similar to Uruguayans are Immigrants from Malaysia (52.7%, a difference of 0.030%), Immigrants from Eritrea (52.6%, a difference of 0.040%), Immigrants from Hong Kong (52.6%, a difference of 0.18%), Nigerian (52.8%, a difference of 0.22%), and Immigrants from Portugal (52.8%, a difference of 0.27%).
| Demographics | Rating | Rank | 2 or more Vehicles in Household |
| Colombians | 1.1 /100 | #248 | Tragic 52.9% |
| Immigrants | Brazil | 1.0 /100 | #249 | Tragic 52.8% |
| Mongolians | 1.0 /100 | #250 | Tragic 52.8% |
| Immigrants | Sudan | 1.0 /100 | #251 | Tragic 52.8% |
| Immigrants | Portugal | 1.0 /100 | #252 | Tragic 52.8% |
| Nigerians | 0.9 /100 | #253 | Tragic 52.8% |
| Immigrants | Malaysia | 0.8 /100 | #254 | Tragic 52.7% |
| Uruguayans | 0.7 /100 | #255 | Tragic 52.7% |
| Immigrants | Eritrea | 0.7 /100 | #256 | Tragic 52.6% |
| Immigrants | Hong Kong | 0.6 /100 | #257 | Tragic 52.6% |
| Central American Indians | 0.6 /100 | #258 | Tragic 52.5% |
| Alsatians | 0.6 /100 | #259 | Tragic 52.5% |
| Immigrants | Bahamas | 0.5 /100 | #260 | Tragic 52.5% |
| Immigrants | Australia | 0.5 /100 | #261 | Tragic 52.4% |
| Immigrants | Northern Africa | 0.4 /100 | #262 | Tragic 52.3% |
Demographics Similar to West Indians by 2 or more Vehicles in Household
In terms of 2 or more vehicles in household, the demographic groups most similar to West Indians are Immigrants from Dominica (41.6%, a difference of 0.85%), Trinidadian and Tobagonian (40.9%, a difference of 0.98%), Ecuadorian (42.0%, a difference of 1.7%), Immigrants from Ecuador (40.5%, a difference of 1.9%), and Immigrants from Trinidad and Tobago (40.3%, a difference of 2.5%).
| Demographics | Rating | Rank | 2 or more Vehicles in Household |
| Immigrants | Cabo Verde | 0.0 /100 | #324 | Tragic 43.3% |
| Immigrants | West Indies | 0.0 /100 | #325 | Tragic 43.1% |
| Immigrants | Senegal | 0.0 /100 | #326 | Tragic 43.0% |
| Immigrants | Yemen | 0.0 /100 | #327 | Tragic 42.8% |
| Inupiat | 0.0 /100 | #328 | Tragic 42.6% |
| Ecuadorians | 0.0 /100 | #329 | Tragic 42.0% |
| Immigrants | Dominica | 0.0 /100 | #330 | Tragic 41.6% |
| West Indians | 0.0 /100 | #331 | Tragic 41.3% |
| Trinidadians and Tobagonians | 0.0 /100 | #332 | Tragic 40.9% |
| Immigrants | Ecuador | 0.0 /100 | #333 | Tragic 40.5% |
| Immigrants | Trinidad and Tobago | 0.0 /100 | #334 | Tragic 40.3% |
| Immigrants | Bangladesh | 0.0 /100 | #335 | Tragic 38.8% |
| Vietnamese | 0.0 /100 | #336 | Tragic 38.5% |
| Barbadians | 0.0 /100 | #337 | Tragic 38.3% |
| Immigrants | Uzbekistan | 0.0 /100 | #338 | Tragic 37.9% |