Paiute vs Latvian 2 or more Vehicles in Household
COMPARE
Paiute
Latvian
2 or more Vehicles in Household
2 or more Vehicles in Household Comparison
Paiute
Latvians
55.8%
2 OR MORE VEHICLES IN HOUSEHOLD
68.0/ 100
METRIC RATING
159th/ 347
METRIC RANK
56.2%
2 OR MORE VEHICLES IN HOUSEHOLD
83.6/ 100
METRIC RATING
140th/ 347
METRIC RANK
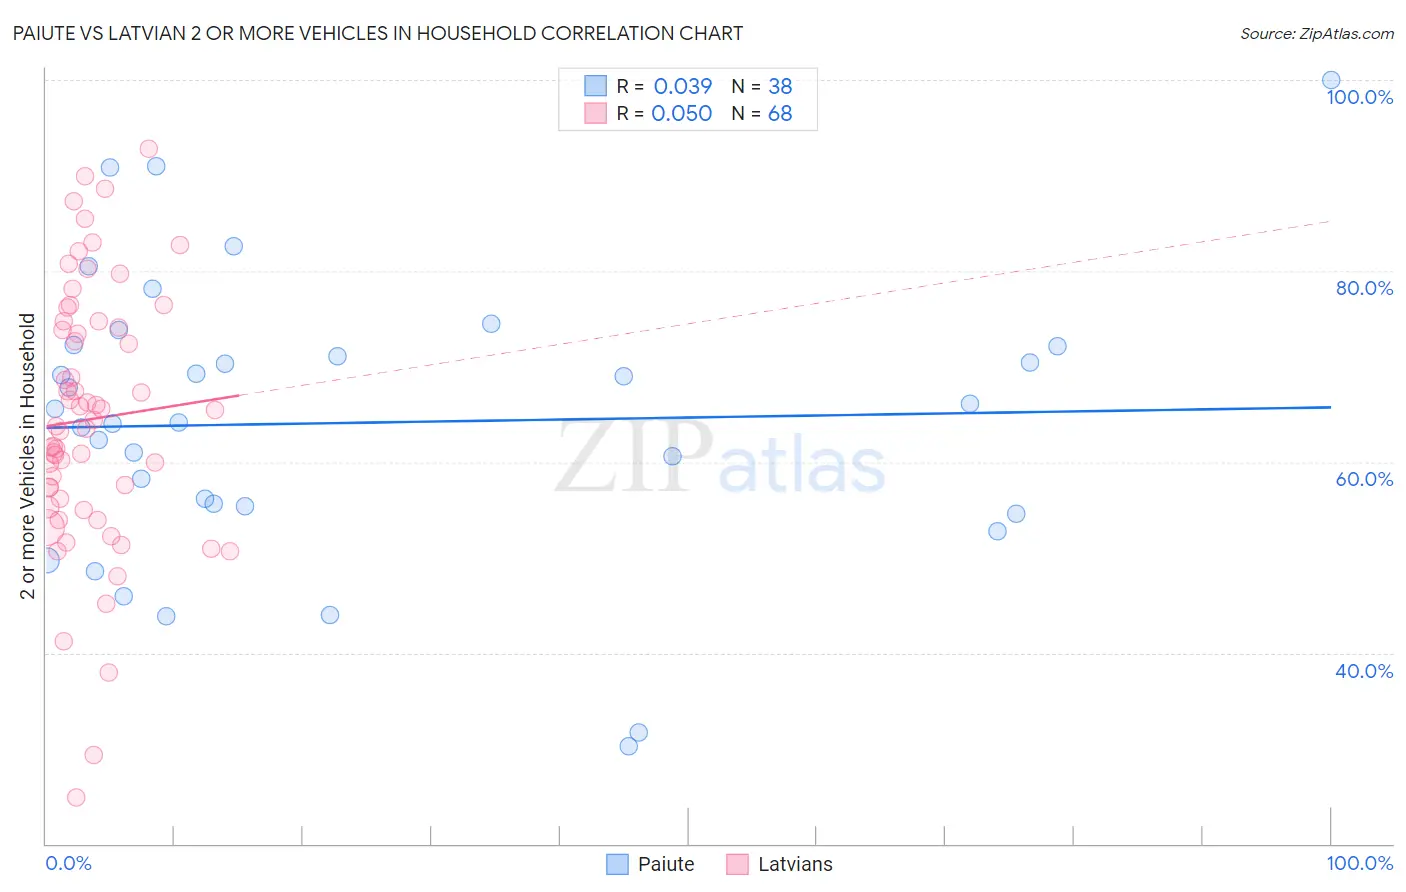
Paiute vs Latvian 2 or more Vehicles in Household Correlation Chart
The statistical analysis conducted on geographies consisting of 58,398,670 people shows no correlation between the proportion of Paiute and percentage of households with 2 or more vehicles available in the United States with a correlation coefficient (R) of 0.039 and weighted average of 55.8%. Similarly, the statistical analysis conducted on geographies consisting of 220,663,993 people shows no correlation between the proportion of Latvians and percentage of households with 2 or more vehicles available in the United States with a correlation coefficient (R) of 0.050 and weighted average of 56.2%, a difference of 0.86%.
2 or more Vehicles in Household Correlation Summary
| Measurement | Paiute | Latvian |
| Minimum | 30.2% | 24.9% |
| Maximum | 100.0% | 92.8% |
| Range | 69.8% | 67.9% |
| Mean | 64.1% | 64.5% |
| Median | 64.9% | 64.1% |
| Interquartile 25% (IQ1) | 55.3% | 55.7% |
| Interquartile 75% (IQ3) | 72.1% | 74.4% |
| Interquartile Range (IQR) | 16.8% | 18.7% |
| Standard Deviation (Sample) | 15.1% | 13.8% |
| Standard Deviation (Population) | 14.9% | 13.7% |
Demographics Similar to Paiute and Latvians by 2 or more Vehicles in Household
In terms of 2 or more vehicles in household, the demographic groups most similar to Paiute are Tlingit-Haida (55.8%, a difference of 0.020%), Immigrants from Kuwait (55.8%, a difference of 0.10%), Immigrants from Lithuania (55.8%, a difference of 0.11%), Immigrants from Venezuela (55.8%, a difference of 0.12%), and Ukrainian (55.8%, a difference of 0.13%). Similarly, the demographic groups most similar to Latvians are Immigrants from Cambodia (56.2%, a difference of 0.0%), South African (56.2%, a difference of 0.040%), Armenian (56.3%, a difference of 0.050%), Seminole (56.2%, a difference of 0.13%), and Immigrants from Syria (56.2%, a difference of 0.15%).
| Demographics | Rating | Rank | 2 or more Vehicles in Household |
| Armenians | 84.3 /100 | #139 | Excellent 56.3% |
| Latvians | 83.6 /100 | #140 | Excellent 56.2% |
| Immigrants | Cambodia | 83.6 /100 | #141 | Excellent 56.2% |
| South Africans | 83.1 /100 | #142 | Excellent 56.2% |
| Seminole | 81.7 /100 | #143 | Excellent 56.2% |
| Immigrants | Syria | 81.4 /100 | #144 | Excellent 56.2% |
| Syrians | 81.2 /100 | #145 | Excellent 56.2% |
| Venezuelans | 80.7 /100 | #146 | Excellent 56.1% |
| Serbians | 80.3 /100 | #147 | Excellent 56.1% |
| Immigrants | Moldova | 80.2 /100 | #148 | Excellent 56.1% |
| Chileans | 80.2 /100 | #149 | Excellent 56.1% |
| Nicaraguans | 79.9 /100 | #150 | Good 56.1% |
| Immigrants | Northern Europe | 78.7 /100 | #151 | Good 56.1% |
| Immigrants | Pakistan | 78.1 /100 | #152 | Good 56.1% |
| Lumbee | 71.9 /100 | #153 | Good 55.9% |
| Ukrainians | 70.8 /100 | #154 | Good 55.8% |
| Immigrants | Venezuela | 70.7 /100 | #155 | Good 55.8% |
| Immigrants | Lithuania | 70.4 /100 | #156 | Good 55.8% |
| Immigrants | Kuwait | 70.2 /100 | #157 | Good 55.8% |
| Tlingit-Haida | 68.5 /100 | #158 | Good 55.8% |
| Paiute | 68.0 /100 | #159 | Good 55.8% |