Paiute vs Uruguayan 2 or more Vehicles in Household
COMPARE
Paiute
Uruguayan
2 or more Vehicles in Household
2 or more Vehicles in Household Comparison
Paiute
Uruguayans
55.8%
2 OR MORE VEHICLES IN HOUSEHOLD
68.0/ 100
METRIC RATING
159th/ 347
METRIC RANK
52.7%
2 OR MORE VEHICLES IN HOUSEHOLD
0.7/ 100
METRIC RATING
255th/ 347
METRIC RANK
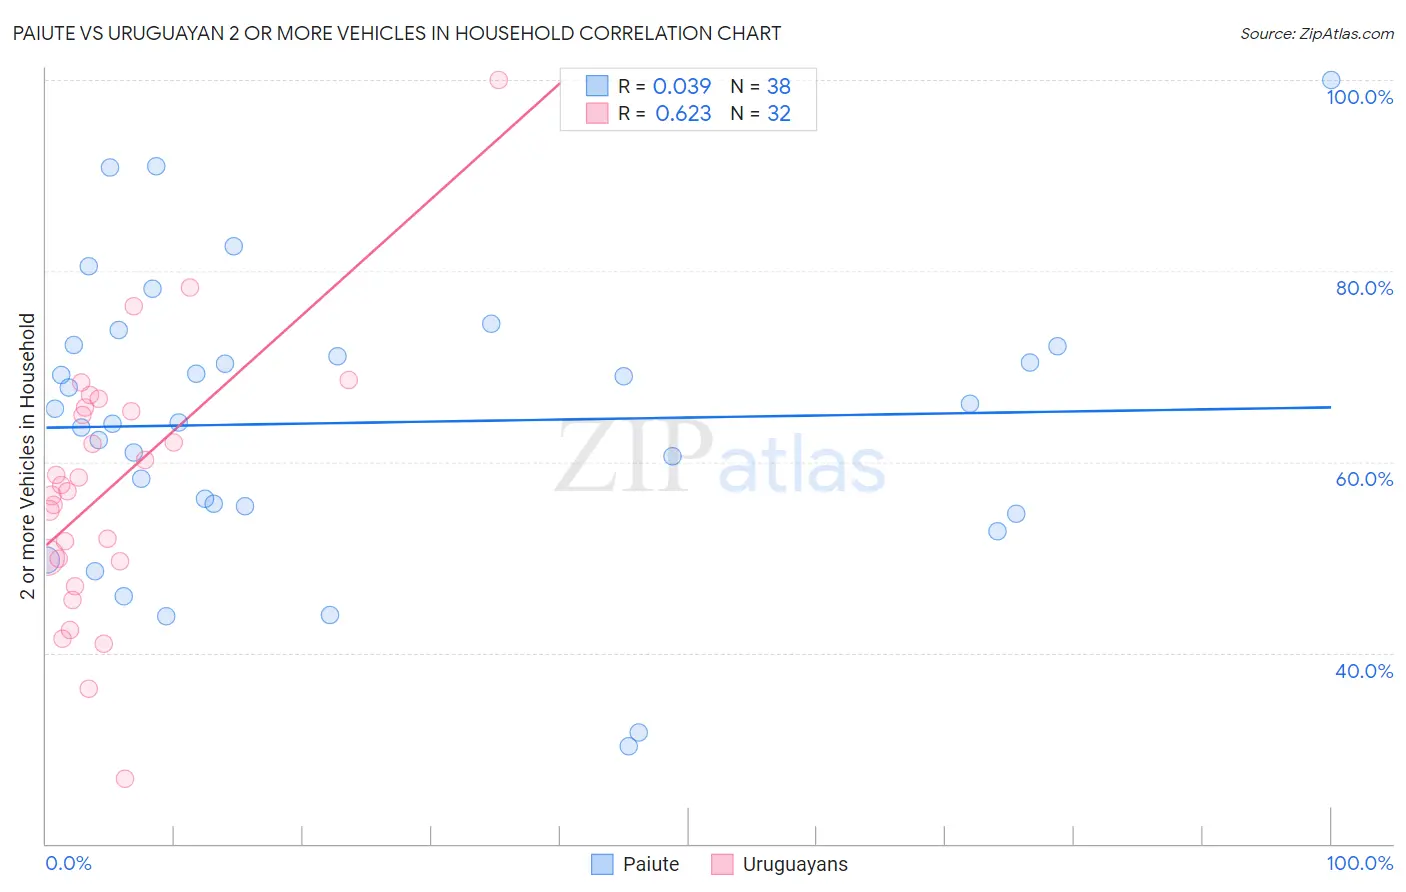
Paiute vs Uruguayan 2 or more Vehicles in Household Correlation Chart
The statistical analysis conducted on geographies consisting of 58,398,670 people shows no correlation between the proportion of Paiute and percentage of households with 2 or more vehicles available in the United States with a correlation coefficient (R) of 0.039 and weighted average of 55.8%. Similarly, the statistical analysis conducted on geographies consisting of 144,759,773 people shows a significant positive correlation between the proportion of Uruguayans and percentage of households with 2 or more vehicles available in the United States with a correlation coefficient (R) of 0.623 and weighted average of 52.7%, a difference of 5.9%.
2 or more Vehicles in Household Correlation Summary
| Measurement | Paiute | Uruguayan |
| Minimum | 30.2% | 26.8% |
| Maximum | 100.0% | 100.0% |
| Range | 69.8% | 73.2% |
| Mean | 64.1% | 57.4% |
| Median | 64.9% | 57.3% |
| Interquartile 25% (IQ1) | 55.3% | 49.8% |
| Interquartile 75% (IQ3) | 72.1% | 65.5% |
| Interquartile Range (IQR) | 16.8% | 15.7% |
| Standard Deviation (Sample) | 15.1% | 13.8% |
| Standard Deviation (Population) | 14.9% | 13.6% |
Similar Demographics by 2 or more Vehicles in Household
Demographics Similar to Paiute by 2 or more Vehicles in Household
In terms of 2 or more vehicles in household, the demographic groups most similar to Paiute are Tlingit-Haida (55.8%, a difference of 0.020%), Crow (55.7%, a difference of 0.050%), Immigrants from Kuwait (55.8%, a difference of 0.10%), Immigrants from Lithuania (55.8%, a difference of 0.11%), and Immigrants from Venezuela (55.8%, a difference of 0.12%).
| Demographics | Rating | Rank | 2 or more Vehicles in Household |
| Immigrants | Pakistan | 78.1 /100 | #152 | Good 56.1% |
| Lumbee | 71.9 /100 | #153 | Good 55.9% |
| Ukrainians | 70.8 /100 | #154 | Good 55.8% |
| Immigrants | Venezuela | 70.7 /100 | #155 | Good 55.8% |
| Immigrants | Lithuania | 70.4 /100 | #156 | Good 55.8% |
| Immigrants | Kuwait | 70.2 /100 | #157 | Good 55.8% |
| Tlingit-Haida | 68.5 /100 | #158 | Good 55.8% |
| Paiute | 68.0 /100 | #159 | Good 55.8% |
| Crow | 67.0 /100 | #160 | Good 55.7% |
| Colville | 61.1 /100 | #161 | Good 55.6% |
| German Russians | 60.9 /100 | #162 | Good 55.6% |
| Immigrants | Zimbabwe | 60.2 /100 | #163 | Good 55.6% |
| Dutch West Indians | 59.8 /100 | #164 | Average 55.6% |
| Immigrants | El Salvador | 59.4 /100 | #165 | Average 55.6% |
| Immigrants | Sri Lanka | 58.3 /100 | #166 | Average 55.5% |
Demographics Similar to Uruguayans by 2 or more Vehicles in Household
In terms of 2 or more vehicles in household, the demographic groups most similar to Uruguayans are Immigrants from Malaysia (52.7%, a difference of 0.030%), Immigrants from Eritrea (52.6%, a difference of 0.040%), Immigrants from Hong Kong (52.6%, a difference of 0.18%), Nigerian (52.8%, a difference of 0.22%), and Immigrants from Portugal (52.8%, a difference of 0.27%).
| Demographics | Rating | Rank | 2 or more Vehicles in Household |
| Colombians | 1.1 /100 | #248 | Tragic 52.9% |
| Immigrants | Brazil | 1.0 /100 | #249 | Tragic 52.8% |
| Mongolians | 1.0 /100 | #250 | Tragic 52.8% |
| Immigrants | Sudan | 1.0 /100 | #251 | Tragic 52.8% |
| Immigrants | Portugal | 1.0 /100 | #252 | Tragic 52.8% |
| Nigerians | 0.9 /100 | #253 | Tragic 52.8% |
| Immigrants | Malaysia | 0.8 /100 | #254 | Tragic 52.7% |
| Uruguayans | 0.7 /100 | #255 | Tragic 52.7% |
| Immigrants | Eritrea | 0.7 /100 | #256 | Tragic 52.6% |
| Immigrants | Hong Kong | 0.6 /100 | #257 | Tragic 52.6% |
| Central American Indians | 0.6 /100 | #258 | Tragic 52.5% |
| Alsatians | 0.6 /100 | #259 | Tragic 52.5% |
| Immigrants | Bahamas | 0.5 /100 | #260 | Tragic 52.5% |
| Immigrants | Australia | 0.5 /100 | #261 | Tragic 52.4% |
| Immigrants | Northern Africa | 0.4 /100 | #262 | Tragic 52.3% |