Scandinavian vs Uruguayan 2 or more Vehicles in Household
COMPARE
Scandinavian
Uruguayan
2 or more Vehicles in Household
2 or more Vehicles in Household Comparison
Scandinavians
Uruguayans
62.1%
2 OR MORE VEHICLES IN HOUSEHOLD
100.0/ 100
METRIC RATING
6th/ 347
METRIC RANK
52.7%
2 OR MORE VEHICLES IN HOUSEHOLD
0.7/ 100
METRIC RATING
255th/ 347
METRIC RANK
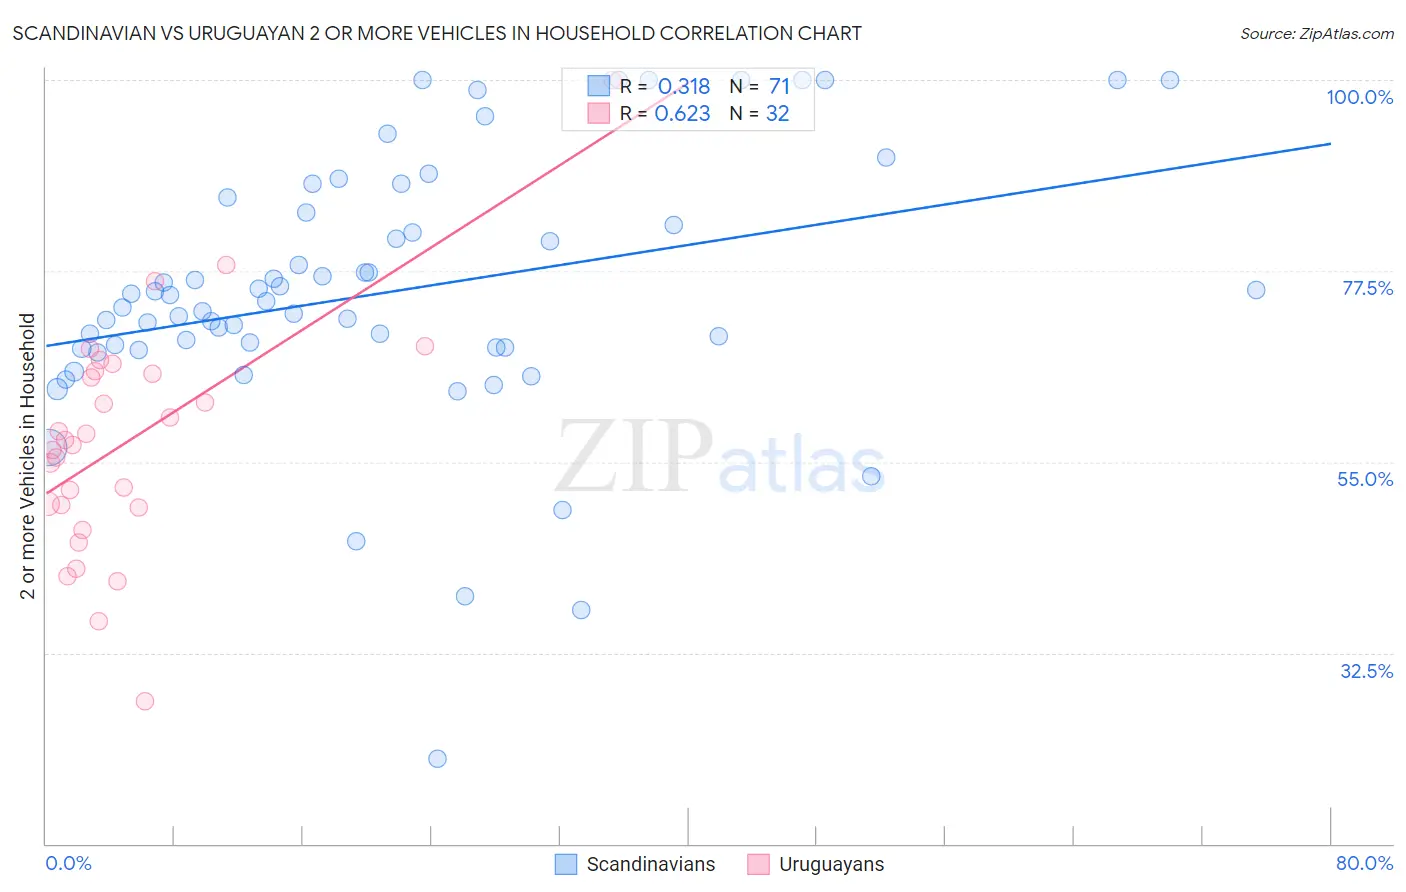
Scandinavian vs Uruguayan 2 or more Vehicles in Household Correlation Chart
The statistical analysis conducted on geographies consisting of 472,330,499 people shows a mild positive correlation between the proportion of Scandinavians and percentage of households with 2 or more vehicles available in the United States with a correlation coefficient (R) of 0.318 and weighted average of 62.1%. Similarly, the statistical analysis conducted on geographies consisting of 144,759,773 people shows a significant positive correlation between the proportion of Uruguayans and percentage of households with 2 or more vehicles available in the United States with a correlation coefficient (R) of 0.623 and weighted average of 52.7%, a difference of 17.9%.
2 or more Vehicles in Household Correlation Summary
| Measurement | Scandinavian | Uruguayan |
| Minimum | 20.0% | 26.8% |
| Maximum | 100.0% | 100.0% |
| Range | 80.0% | 73.2% |
| Mean | 75.0% | 57.4% |
| Median | 73.9% | 57.3% |
| Interquartile 25% (IQ1) | 68.4% | 49.8% |
| Interquartile 75% (IQ3) | 84.4% | 65.5% |
| Interquartile Range (IQR) | 16.0% | 15.7% |
| Standard Deviation (Sample) | 15.6% | 13.8% |
| Standard Deviation (Population) | 15.5% | 13.6% |
Similar Demographics by 2 or more Vehicles in Household
Demographics Similar to Scandinavians by 2 or more Vehicles in Household
In terms of 2 or more vehicles in household, the demographic groups most similar to Scandinavians are Puget Sound Salish (62.1%, a difference of 0.060%), English (61.9%, a difference of 0.33%), Immigrants from Fiji (62.3%, a difference of 0.34%), Swedish (61.8%, a difference of 0.40%), and Mexican (61.7%, a difference of 0.68%).
| Demographics | Rating | Rank | 2 or more Vehicles in Household |
| Yakama | 100.0 /100 | #1 | Exceptional 64.9% |
| Tongans | 100.0 /100 | #2 | Exceptional 63.5% |
| Danes | 100.0 /100 | #3 | Exceptional 63.3% |
| Norwegians | 100.0 /100 | #4 | Exceptional 62.8% |
| Immigrants | Fiji | 100.0 /100 | #5 | Exceptional 62.3% |
| Scandinavians | 100.0 /100 | #6 | Exceptional 62.1% |
| Puget Sound Salish | 100.0 /100 | #7 | Exceptional 62.1% |
| English | 100.0 /100 | #8 | Exceptional 61.9% |
| Swedes | 100.0 /100 | #9 | Exceptional 61.8% |
| Mexicans | 100.0 /100 | #10 | Exceptional 61.7% |
| Dutch | 100.0 /100 | #11 | Exceptional 61.6% |
| Germans | 100.0 /100 | #12 | Exceptional 61.6% |
| Samoans | 100.0 /100 | #13 | Exceptional 61.5% |
| Czechs | 100.0 /100 | #14 | Exceptional 61.5% |
| Nepalese | 100.0 /100 | #15 | Exceptional 61.4% |
Demographics Similar to Uruguayans by 2 or more Vehicles in Household
In terms of 2 or more vehicles in household, the demographic groups most similar to Uruguayans are Immigrants from Malaysia (52.7%, a difference of 0.030%), Immigrants from Eritrea (52.6%, a difference of 0.040%), Immigrants from Hong Kong (52.6%, a difference of 0.18%), Nigerian (52.8%, a difference of 0.22%), and Immigrants from Portugal (52.8%, a difference of 0.27%).
| Demographics | Rating | Rank | 2 or more Vehicles in Household |
| Colombians | 1.1 /100 | #248 | Tragic 52.9% |
| Immigrants | Brazil | 1.0 /100 | #249 | Tragic 52.8% |
| Mongolians | 1.0 /100 | #250 | Tragic 52.8% |
| Immigrants | Sudan | 1.0 /100 | #251 | Tragic 52.8% |
| Immigrants | Portugal | 1.0 /100 | #252 | Tragic 52.8% |
| Nigerians | 0.9 /100 | #253 | Tragic 52.8% |
| Immigrants | Malaysia | 0.8 /100 | #254 | Tragic 52.7% |
| Uruguayans | 0.7 /100 | #255 | Tragic 52.7% |
| Immigrants | Eritrea | 0.7 /100 | #256 | Tragic 52.6% |
| Immigrants | Hong Kong | 0.6 /100 | #257 | Tragic 52.6% |
| Central American Indians | 0.6 /100 | #258 | Tragic 52.5% |
| Alsatians | 0.6 /100 | #259 | Tragic 52.5% |
| Immigrants | Bahamas | 0.5 /100 | #260 | Tragic 52.5% |
| Immigrants | Australia | 0.5 /100 | #261 | Tragic 52.4% |
| Immigrants | Northern Africa | 0.4 /100 | #262 | Tragic 52.3% |