Arapaho vs Uruguayan 2 or more Vehicles in Household
COMPARE
Arapaho
Uruguayan
2 or more Vehicles in Household
2 or more Vehicles in Household Comparison
Arapaho
Uruguayans
60.2%
2 OR MORE VEHICLES IN HOUSEHOLD
100.0/ 100
METRIC RATING
32nd/ 347
METRIC RANK
52.7%
2 OR MORE VEHICLES IN HOUSEHOLD
0.7/ 100
METRIC RATING
255th/ 347
METRIC RANK
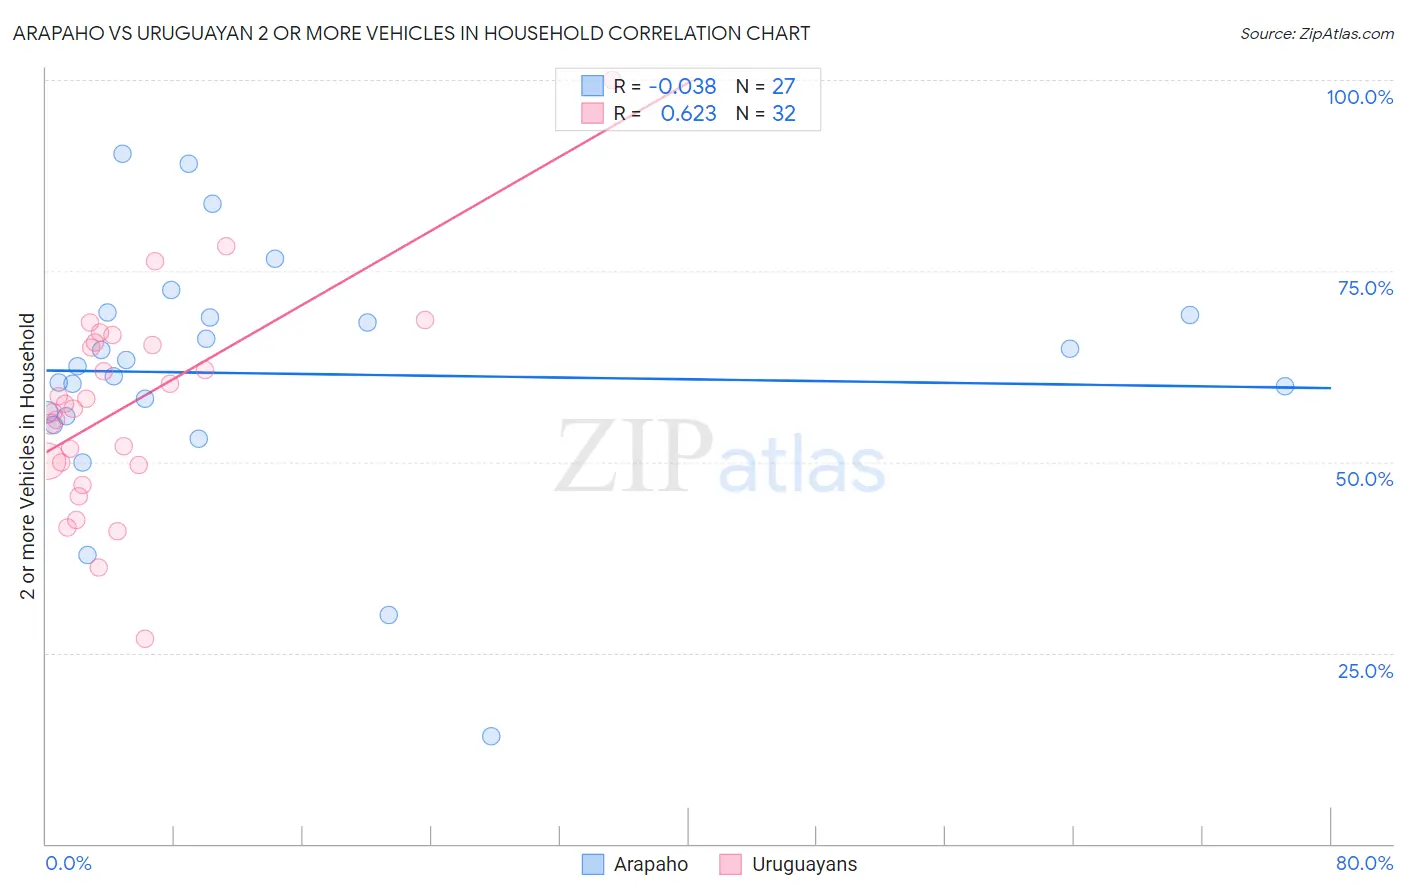
Arapaho vs Uruguayan 2 or more Vehicles in Household Correlation Chart
The statistical analysis conducted on geographies consisting of 29,778,572 people shows no correlation between the proportion of Arapaho and percentage of households with 2 or more vehicles available in the United States with a correlation coefficient (R) of -0.038 and weighted average of 60.2%. Similarly, the statistical analysis conducted on geographies consisting of 144,759,773 people shows a significant positive correlation between the proportion of Uruguayans and percentage of households with 2 or more vehicles available in the United States with a correlation coefficient (R) of 0.623 and weighted average of 52.7%, a difference of 14.4%.
2 or more Vehicles in Household Correlation Summary
| Measurement | Arapaho | Uruguayan |
| Minimum | 14.1% | 26.8% |
| Maximum | 90.3% | 100.0% |
| Range | 76.2% | 73.2% |
| Mean | 61.5% | 57.4% |
| Median | 62.5% | 57.3% |
| Interquartile 25% (IQ1) | 56.0% | 49.8% |
| Interquartile 75% (IQ3) | 69.3% | 65.5% |
| Interquartile Range (IQR) | 13.3% | 15.7% |
| Standard Deviation (Sample) | 16.2% | 13.8% |
| Standard Deviation (Population) | 15.9% | 13.6% |
Similar Demographics by 2 or more Vehicles in Household
Demographics Similar to Arapaho by 2 or more Vehicles in Household
In terms of 2 or more vehicles in household, the demographic groups most similar to Arapaho are Immigrants from Mexico (60.2%, a difference of 0.060%), Spanish American Indian (60.3%, a difference of 0.11%), Spanish (60.2%, a difference of 0.11%), Finnish (60.3%, a difference of 0.13%), and Immigrants from Philippines (60.1%, a difference of 0.23%).
| Demographics | Rating | Rank | 2 or more Vehicles in Household |
| Whites/Caucasians | 100.0 /100 | #25 | Exceptional 60.8% |
| Welsh | 100.0 /100 | #26 | Exceptional 60.8% |
| Assyrians/Chaldeans/Syriacs | 100.0 /100 | #27 | Exceptional 60.5% |
| Guamanians/Chamorros | 100.0 /100 | #28 | Exceptional 60.5% |
| Hawaiians | 100.0 /100 | #29 | Exceptional 60.4% |
| Finns | 100.0 /100 | #30 | Exceptional 60.3% |
| Spanish American Indians | 100.0 /100 | #31 | Exceptional 60.3% |
| Arapaho | 100.0 /100 | #32 | Exceptional 60.2% |
| Immigrants | Mexico | 100.0 /100 | #33 | Exceptional 60.2% |
| Spanish | 100.0 /100 | #34 | Exceptional 60.2% |
| Immigrants | Philippines | 100.0 /100 | #35 | Exceptional 60.1% |
| Chinese | 100.0 /100 | #36 | Exceptional 60.1% |
| Irish | 100.0 /100 | #37 | Exceptional 60.1% |
| Americans | 100.0 /100 | #38 | Exceptional 60.0% |
| British | 100.0 /100 | #39 | Exceptional 60.0% |
Demographics Similar to Uruguayans by 2 or more Vehicles in Household
In terms of 2 or more vehicles in household, the demographic groups most similar to Uruguayans are Immigrants from Malaysia (52.7%, a difference of 0.030%), Immigrants from Eritrea (52.6%, a difference of 0.040%), Immigrants from Hong Kong (52.6%, a difference of 0.18%), Nigerian (52.8%, a difference of 0.22%), and Immigrants from Portugal (52.8%, a difference of 0.27%).
| Demographics | Rating | Rank | 2 or more Vehicles in Household |
| Colombians | 1.1 /100 | #248 | Tragic 52.9% |
| Immigrants | Brazil | 1.0 /100 | #249 | Tragic 52.8% |
| Mongolians | 1.0 /100 | #250 | Tragic 52.8% |
| Immigrants | Sudan | 1.0 /100 | #251 | Tragic 52.8% |
| Immigrants | Portugal | 1.0 /100 | #252 | Tragic 52.8% |
| Nigerians | 0.9 /100 | #253 | Tragic 52.8% |
| Immigrants | Malaysia | 0.8 /100 | #254 | Tragic 52.7% |
| Uruguayans | 0.7 /100 | #255 | Tragic 52.7% |
| Immigrants | Eritrea | 0.7 /100 | #256 | Tragic 52.6% |
| Immigrants | Hong Kong | 0.6 /100 | #257 | Tragic 52.6% |
| Central American Indians | 0.6 /100 | #258 | Tragic 52.5% |
| Alsatians | 0.6 /100 | #259 | Tragic 52.5% |
| Immigrants | Bahamas | 0.5 /100 | #260 | Tragic 52.5% |
| Immigrants | Australia | 0.5 /100 | #261 | Tragic 52.4% |
| Immigrants | Northern Africa | 0.4 /100 | #262 | Tragic 52.3% |