Immigrants from Russia vs Uruguayan 2 or more Vehicles in Household
COMPARE
Immigrants from Russia
Uruguayan
2 or more Vehicles in Household
2 or more Vehicles in Household Comparison
Immigrants from Russia
Uruguayans
50.3%
2 OR MORE VEHICLES IN HOUSEHOLD
0.0/ 100
METRIC RATING
300th/ 347
METRIC RANK
52.7%
2 OR MORE VEHICLES IN HOUSEHOLD
0.7/ 100
METRIC RATING
255th/ 347
METRIC RANK
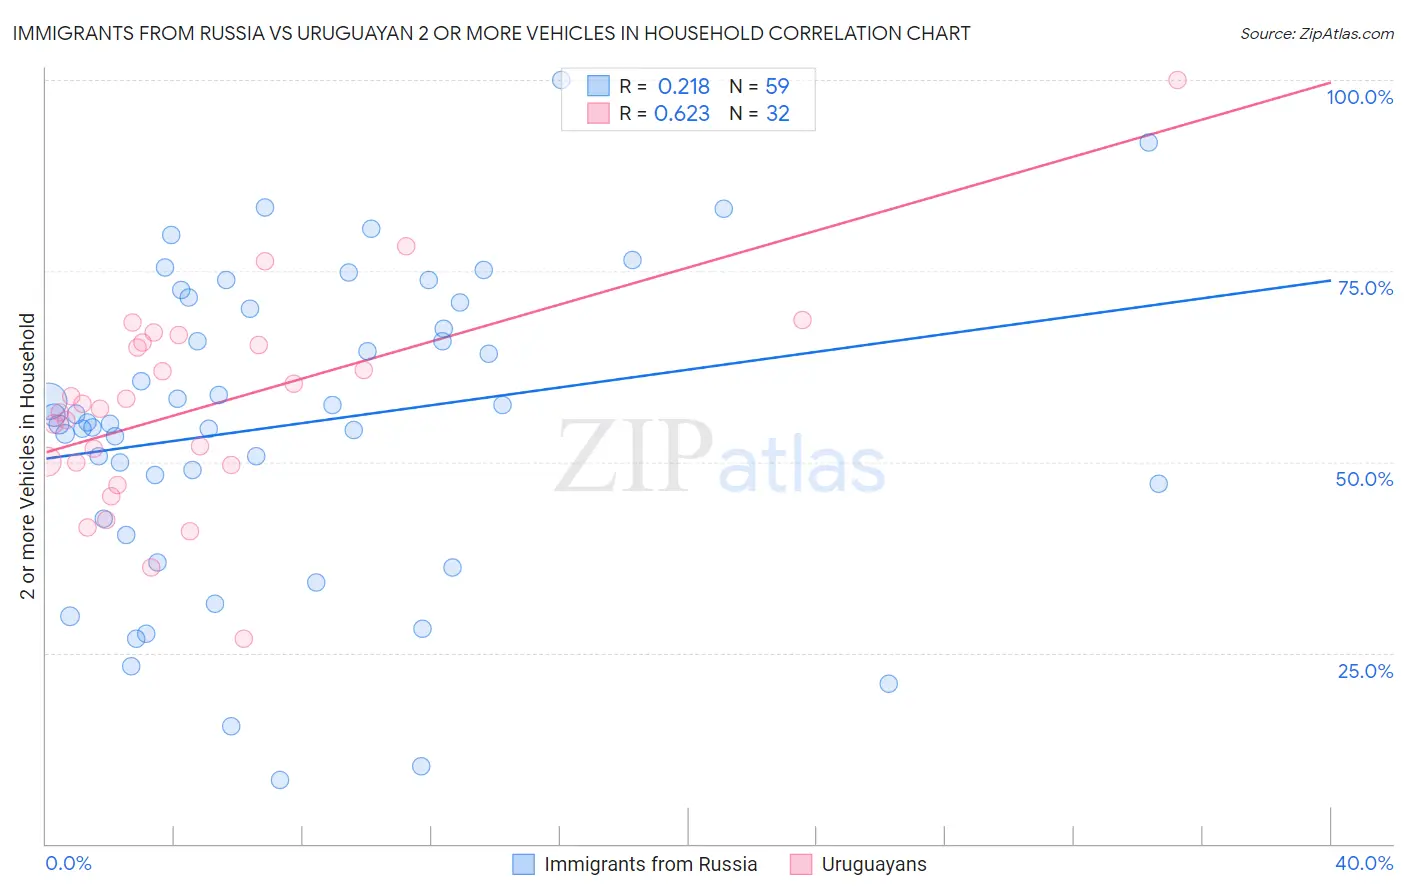
Immigrants from Russia vs Uruguayan 2 or more Vehicles in Household Correlation Chart
The statistical analysis conducted on geographies consisting of 347,736,627 people shows a weak positive correlation between the proportion of Immigrants from Russia and percentage of households with 2 or more vehicles available in the United States with a correlation coefficient (R) of 0.218 and weighted average of 50.3%. Similarly, the statistical analysis conducted on geographies consisting of 144,759,773 people shows a significant positive correlation between the proportion of Uruguayans and percentage of households with 2 or more vehicles available in the United States with a correlation coefficient (R) of 0.623 and weighted average of 52.7%, a difference of 4.7%.
2 or more Vehicles in Household Correlation Summary
| Measurement | Immigrants from Russia | Uruguayan |
| Minimum | 8.3% | 26.8% |
| Maximum | 100.0% | 100.0% |
| Range | 91.7% | 73.2% |
| Mean | 54.9% | 57.4% |
| Median | 55.2% | 57.3% |
| Interquartile 25% (IQ1) | 42.6% | 49.8% |
| Interquartile 75% (IQ3) | 70.9% | 65.5% |
| Interquartile Range (IQR) | 28.3% | 15.7% |
| Standard Deviation (Sample) | 20.1% | 13.8% |
| Standard Deviation (Population) | 19.9% | 13.6% |
Similar Demographics by 2 or more Vehicles in Household
Demographics Similar to Immigrants from Russia by 2 or more Vehicles in Household
In terms of 2 or more vehicles in household, the demographic groups most similar to Immigrants from Russia are Immigrants from Morocco (50.3%, a difference of 0.040%), Paraguayan (50.3%, a difference of 0.070%), Immigrants from Greece (50.2%, a difference of 0.18%), Immigrants from Spain (50.4%, a difference of 0.20%), and Immigrants from South America (50.2%, a difference of 0.24%).
| Demographics | Rating | Rank | 2 or more Vehicles in Household |
| Blacks/African Americans | 0.0 /100 | #293 | Tragic 50.9% |
| Bermudans | 0.0 /100 | #294 | Tragic 50.6% |
| Cypriots | 0.0 /100 | #295 | Tragic 50.6% |
| Immigrants | Somalia | 0.0 /100 | #296 | Tragic 50.5% |
| Immigrants | Spain | 0.0 /100 | #297 | Tragic 50.4% |
| Paraguayans | 0.0 /100 | #298 | Tragic 50.3% |
| Immigrants | Morocco | 0.0 /100 | #299 | Tragic 50.3% |
| Immigrants | Russia | 0.0 /100 | #300 | Tragic 50.3% |
| Immigrants | Greece | 0.0 /100 | #301 | Tragic 50.2% |
| Immigrants | South America | 0.0 /100 | #302 | Tragic 50.2% |
| Tohono O'odham | 0.0 /100 | #303 | Tragic 50.0% |
| Immigrants | Belize | 0.0 /100 | #304 | Tragic 49.9% |
| Immigrants | Western Africa | 0.0 /100 | #305 | Tragic 49.4% |
| Immigrants | Israel | 0.0 /100 | #306 | Tragic 49.2% |
| Hopi | 0.0 /100 | #307 | Tragic 49.0% |
Demographics Similar to Uruguayans by 2 or more Vehicles in Household
In terms of 2 or more vehicles in household, the demographic groups most similar to Uruguayans are Immigrants from Malaysia (52.7%, a difference of 0.030%), Immigrants from Eritrea (52.6%, a difference of 0.040%), Immigrants from Hong Kong (52.6%, a difference of 0.18%), Nigerian (52.8%, a difference of 0.22%), and Immigrants from Portugal (52.8%, a difference of 0.27%).
| Demographics | Rating | Rank | 2 or more Vehicles in Household |
| Colombians | 1.1 /100 | #248 | Tragic 52.9% |
| Immigrants | Brazil | 1.0 /100 | #249 | Tragic 52.8% |
| Mongolians | 1.0 /100 | #250 | Tragic 52.8% |
| Immigrants | Sudan | 1.0 /100 | #251 | Tragic 52.8% |
| Immigrants | Portugal | 1.0 /100 | #252 | Tragic 52.8% |
| Nigerians | 0.9 /100 | #253 | Tragic 52.8% |
| Immigrants | Malaysia | 0.8 /100 | #254 | Tragic 52.7% |
| Uruguayans | 0.7 /100 | #255 | Tragic 52.7% |
| Immigrants | Eritrea | 0.7 /100 | #256 | Tragic 52.6% |
| Immigrants | Hong Kong | 0.6 /100 | #257 | Tragic 52.6% |
| Central American Indians | 0.6 /100 | #258 | Tragic 52.5% |
| Alsatians | 0.6 /100 | #259 | Tragic 52.5% |
| Immigrants | Bahamas | 0.5 /100 | #260 | Tragic 52.5% |
| Immigrants | Australia | 0.5 /100 | #261 | Tragic 52.4% |
| Immigrants | Northern Africa | 0.4 /100 | #262 | Tragic 52.3% |