Navajo vs American 3 or more Vehicles in Household
COMPARE
Navajo
American
3 or more Vehicles in Household
3 or more Vehicles in Household Comparison
Navajo
Americans
22.3%
3 OR MORE VEHICLES IN HOUSEHOLD
100.0/ 100
METRIC RATING
59th/ 347
METRIC RANK
22.6%
3 OR MORE VEHICLES IN HOUSEHOLD
100.0/ 100
METRIC RATING
46th/ 347
METRIC RANK
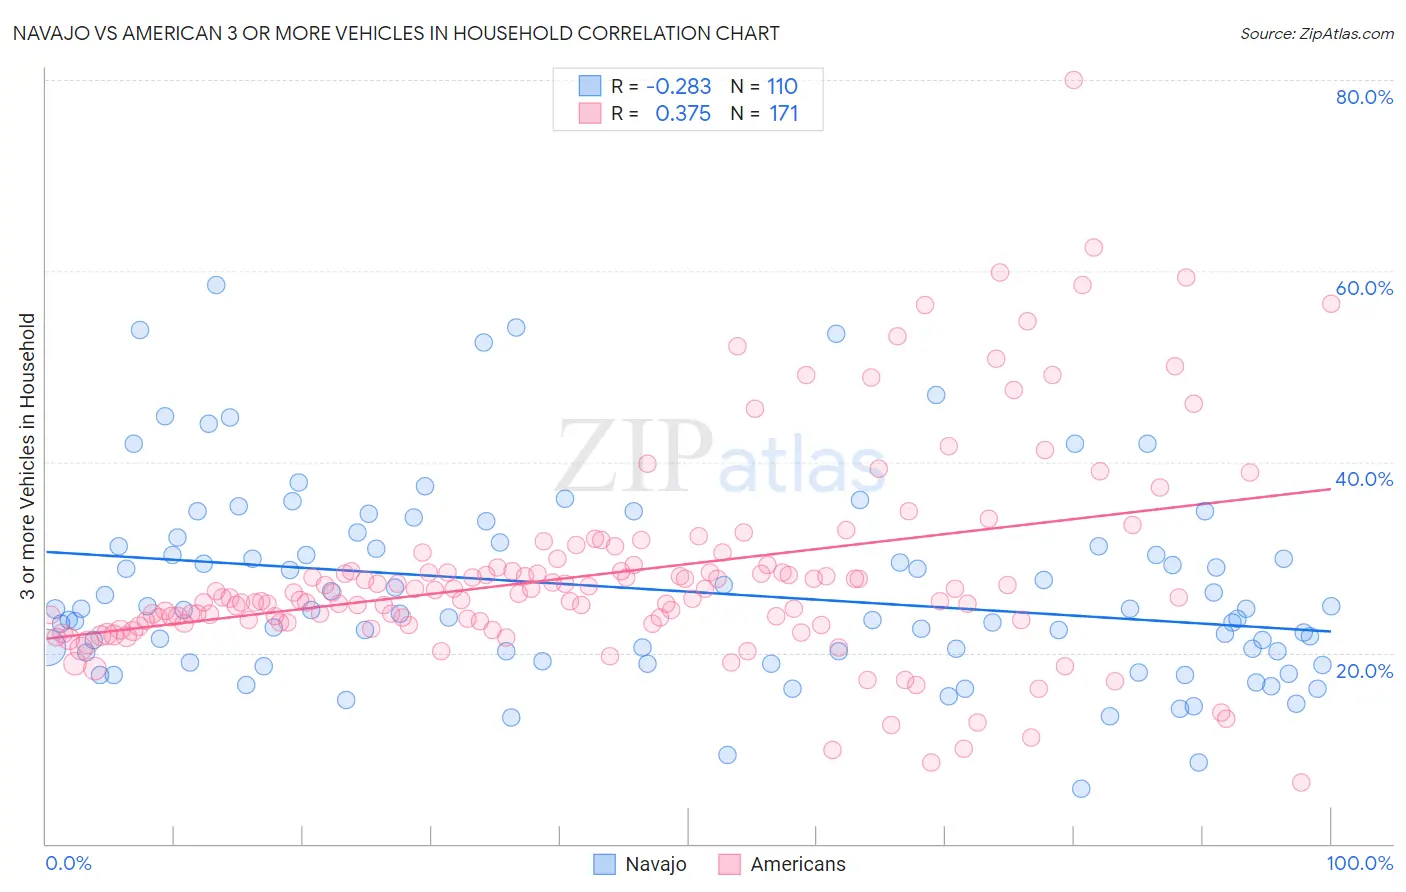
Navajo vs American 3 or more Vehicles in Household Correlation Chart
The statistical analysis conducted on geographies consisting of 224,733,620 people shows a weak negative correlation between the proportion of Navajo and percentage of households with 3 or more vehicles available in the United States with a correlation coefficient (R) of -0.283 and weighted average of 22.3%. Similarly, the statistical analysis conducted on geographies consisting of 581,030,597 people shows a mild positive correlation between the proportion of Americans and percentage of households with 3 or more vehicles available in the United States with a correlation coefficient (R) of 0.375 and weighted average of 22.6%, a difference of 1.5%.
3 or more Vehicles in Household Correlation Summary
| Measurement | Navajo | American |
| Minimum | 5.8% | 6.4% |
| Maximum | 58.5% | 80.0% |
| Range | 52.7% | 73.6% |
| Mean | 26.6% | 28.3% |
| Median | 24.5% | 25.8% |
| Interquartile 25% (IQ1) | 20.0% | 23.2% |
| Interquartile 75% (IQ3) | 31.2% | 29.0% |
| Interquartile Range (IQR) | 11.2% | 5.8% |
| Standard Deviation (Sample) | 10.2% | 10.9% |
| Standard Deviation (Population) | 10.1% | 10.9% |
Demographics Similar to Navajo and Americans by 3 or more Vehicles in Household
In terms of 3 or more vehicles in household, the demographic groups most similar to Navajo are Spaniard (22.3%, a difference of 0.060%), Finnish (22.3%, a difference of 0.090%), Pennsylvania German (22.3%, a difference of 0.19%), Bhutanese (22.2%, a difference of 0.24%), and Fijian (22.2%, a difference of 0.28%). Similarly, the demographic groups most similar to Americans are Malaysian (22.6%, a difference of 0.010%), Scottish (22.6%, a difference of 0.020%), Scotch-Irish (22.6%, a difference of 0.12%), Sioux (22.6%, a difference of 0.18%), and Ute (22.7%, a difference of 0.19%).
| Demographics | Rating | Rank | 3 or more Vehicles in Household |
| Natives/Alaskans | 100.0 /100 | #42 | Exceptional 22.7% |
| Osage | 100.0 /100 | #43 | Exceptional 22.7% |
| Cheyenne | 100.0 /100 | #44 | Exceptional 22.7% |
| Ute | 100.0 /100 | #45 | Exceptional 22.7% |
| Americans | 100.0 /100 | #46 | Exceptional 22.6% |
| Malaysians | 100.0 /100 | #47 | Exceptional 22.6% |
| Scottish | 100.0 /100 | #48 | Exceptional 22.6% |
| Scotch-Irish | 100.0 /100 | #49 | Exceptional 22.6% |
| Sioux | 100.0 /100 | #50 | Exceptional 22.6% |
| Whites/Caucasians | 100.0 /100 | #51 | Exceptional 22.6% |
| Welsh | 100.0 /100 | #52 | Exceptional 22.6% |
| Czechs | 100.0 /100 | #53 | Exceptional 22.5% |
| Crow | 100.0 /100 | #54 | Exceptional 22.5% |
| Immigrants | Laos | 100.0 /100 | #55 | Exceptional 22.4% |
| Hispanics or Latinos | 100.0 /100 | #56 | Exceptional 22.4% |
| Pennsylvania Germans | 100.0 /100 | #57 | Exceptional 22.3% |
| Spaniards | 100.0 /100 | #58 | Exceptional 22.3% |
| Navajo | 100.0 /100 | #59 | Exceptional 22.3% |
| Finns | 99.9 /100 | #60 | Exceptional 22.3% |
| Bhutanese | 99.9 /100 | #61 | Exceptional 22.2% |
| Fijians | 99.9 /100 | #62 | Exceptional 22.2% |