Navajo vs Immigrants from Czechoslovakia 3 or more Vehicles in Household
COMPARE
Navajo
Immigrants from Czechoslovakia
3 or more Vehicles in Household
3 or more Vehicles in Household Comparison
Navajo
Immigrants from Czechoslovakia
22.3%
3 OR MORE VEHICLES IN HOUSEHOLD
100.0/ 100
METRIC RATING
59th/ 347
METRIC RANK
18.5%
3 OR MORE VEHICLES IN HOUSEHOLD
5.9/ 100
METRIC RATING
223rd/ 347
METRIC RANK
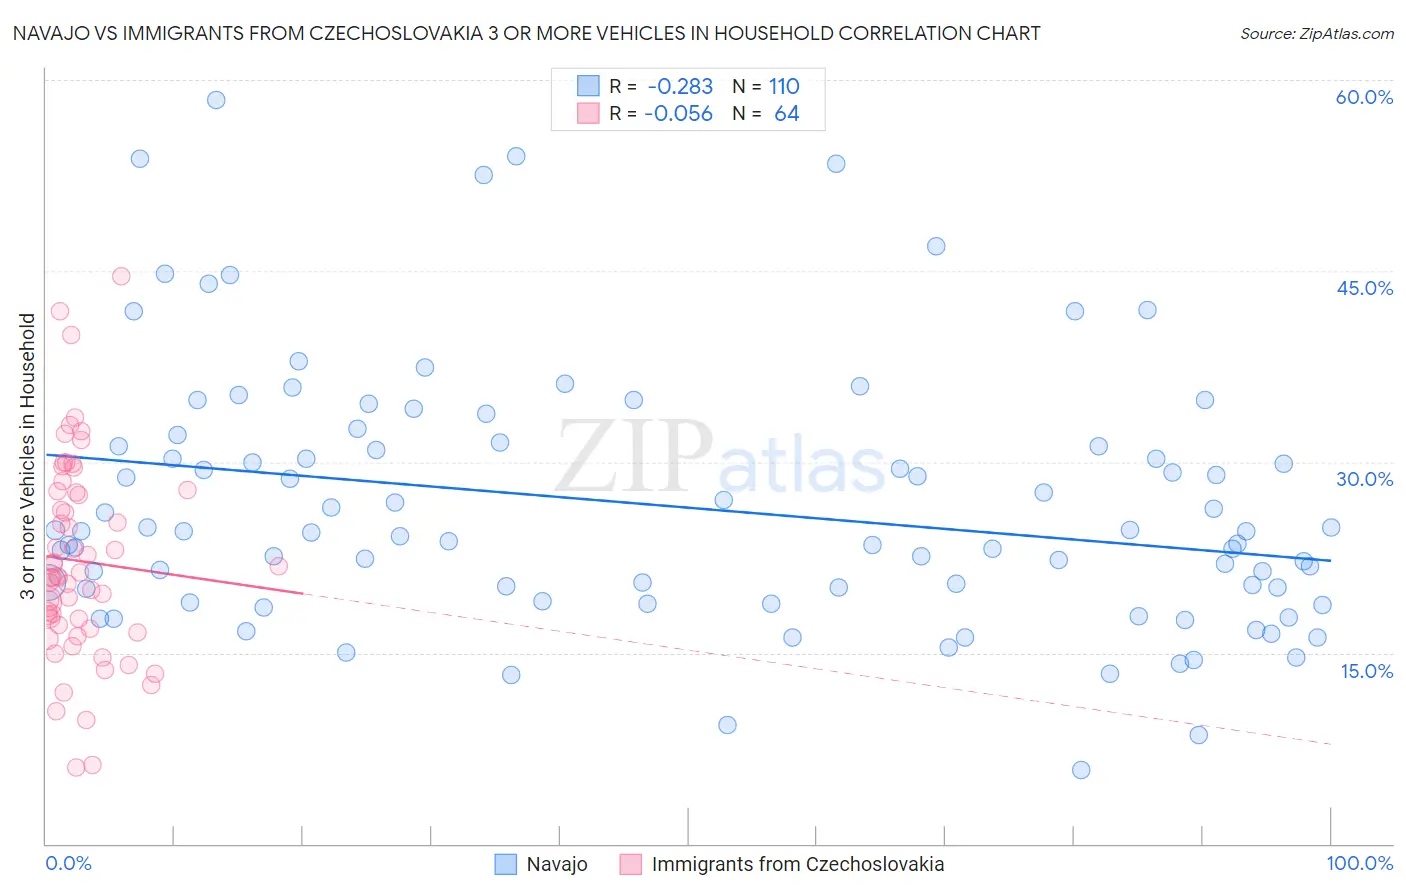
Navajo vs Immigrants from Czechoslovakia 3 or more Vehicles in Household Correlation Chart
The statistical analysis conducted on geographies consisting of 224,733,620 people shows a weak negative correlation between the proportion of Navajo and percentage of households with 3 or more vehicles available in the United States with a correlation coefficient (R) of -0.283 and weighted average of 22.3%. Similarly, the statistical analysis conducted on geographies consisting of 195,424,103 people shows a slight negative correlation between the proportion of Immigrants from Czechoslovakia and percentage of households with 3 or more vehicles available in the United States with a correlation coefficient (R) of -0.056 and weighted average of 18.5%, a difference of 20.7%.
3 or more Vehicles in Household Correlation Summary
| Measurement | Navajo | Immigrants from Czechoslovakia |
| Minimum | 5.8% | 6.0% |
| Maximum | 58.5% | 44.5% |
| Range | 52.7% | 38.5% |
| Mean | 26.6% | 22.2% |
| Median | 24.5% | 21.0% |
| Interquartile 25% (IQ1) | 20.0% | 17.1% |
| Interquartile 75% (IQ3) | 31.2% | 27.6% |
| Interquartile Range (IQR) | 11.2% | 10.6% |
| Standard Deviation (Sample) | 10.2% | 7.9% |
| Standard Deviation (Population) | 10.1% | 7.8% |
Similar Demographics by 3 or more Vehicles in Household
Demographics Similar to Navajo by 3 or more Vehicles in Household
In terms of 3 or more vehicles in household, the demographic groups most similar to Navajo are Spaniard (22.3%, a difference of 0.060%), Finnish (22.3%, a difference of 0.090%), Pennsylvania German (22.3%, a difference of 0.19%), Bhutanese (22.2%, a difference of 0.24%), and Fijian (22.2%, a difference of 0.28%).
| Demographics | Rating | Rank | 3 or more Vehicles in Household |
| Welsh | 100.0 /100 | #52 | Exceptional 22.6% |
| Czechs | 100.0 /100 | #53 | Exceptional 22.5% |
| Crow | 100.0 /100 | #54 | Exceptional 22.5% |
| Immigrants | Laos | 100.0 /100 | #55 | Exceptional 22.4% |
| Hispanics or Latinos | 100.0 /100 | #56 | Exceptional 22.4% |
| Pennsylvania Germans | 100.0 /100 | #57 | Exceptional 22.3% |
| Spaniards | 100.0 /100 | #58 | Exceptional 22.3% |
| Navajo | 100.0 /100 | #59 | Exceptional 22.3% |
| Finns | 99.9 /100 | #60 | Exceptional 22.3% |
| Bhutanese | 99.9 /100 | #61 | Exceptional 22.2% |
| Fijians | 99.9 /100 | #62 | Exceptional 22.2% |
| Chickasaw | 99.9 /100 | #63 | Exceptional 22.2% |
| Immigrants | Taiwan | 99.9 /100 | #64 | Exceptional 22.1% |
| Pima | 99.9 /100 | #65 | Exceptional 22.0% |
| Northern Europeans | 99.9 /100 | #66 | Exceptional 22.0% |
Demographics Similar to Immigrants from Czechoslovakia by 3 or more Vehicles in Household
In terms of 3 or more vehicles in household, the demographic groups most similar to Immigrants from Czechoslovakia are Immigrants from Argentina (18.5%, a difference of 0.11%), Immigrants from Lithuania (18.5%, a difference of 0.11%), Immigrants from Hungary (18.5%, a difference of 0.15%), Immigrants from Singapore (18.4%, a difference of 0.17%), and Turkish (18.4%, a difference of 0.20%).
| Demographics | Rating | Rank | 3 or more Vehicles in Household |
| Immigrants | Nigeria | 10.3 /100 | #216 | Poor 18.7% |
| Immigrants | Italy | 10.2 /100 | #217 | Poor 18.7% |
| Immigrants | Portugal | 8.9 /100 | #218 | Tragic 18.6% |
| Immigrants | Armenia | 8.6 /100 | #219 | Tragic 18.6% |
| Nigerians | 7.9 /100 | #220 | Tragic 18.6% |
| Immigrants | Poland | 7.5 /100 | #221 | Tragic 18.6% |
| Belizeans | 7.3 /100 | #222 | Tragic 18.6% |
| Immigrants | Czechoslovakia | 5.9 /100 | #223 | Tragic 18.5% |
| Immigrants | Argentina | 5.6 /100 | #224 | Tragic 18.5% |
| Immigrants | Lithuania | 5.6 /100 | #225 | Tragic 18.5% |
| Immigrants | Hungary | 5.5 /100 | #226 | Tragic 18.5% |
| Immigrants | Singapore | 5.4 /100 | #227 | Tragic 18.4% |
| Turks | 5.4 /100 | #228 | Tragic 18.4% |
| Immigrants | Switzerland | 5.0 /100 | #229 | Tragic 18.4% |
| Immigrants | Western Asia | 4.8 /100 | #230 | Tragic 18.4% |