Navajo vs Okinawan 3 or more Vehicles in Household
COMPARE
Navajo
Okinawan
3 or more Vehicles in Household
3 or more Vehicles in Household Comparison
Navajo
Okinawans
22.3%
3 OR MORE VEHICLES IN HOUSEHOLD
100.0/ 100
METRIC RATING
59th/ 347
METRIC RANK
17.4%
3 OR MORE VEHICLES IN HOUSEHOLD
0.4/ 100
METRIC RATING
276th/ 347
METRIC RANK
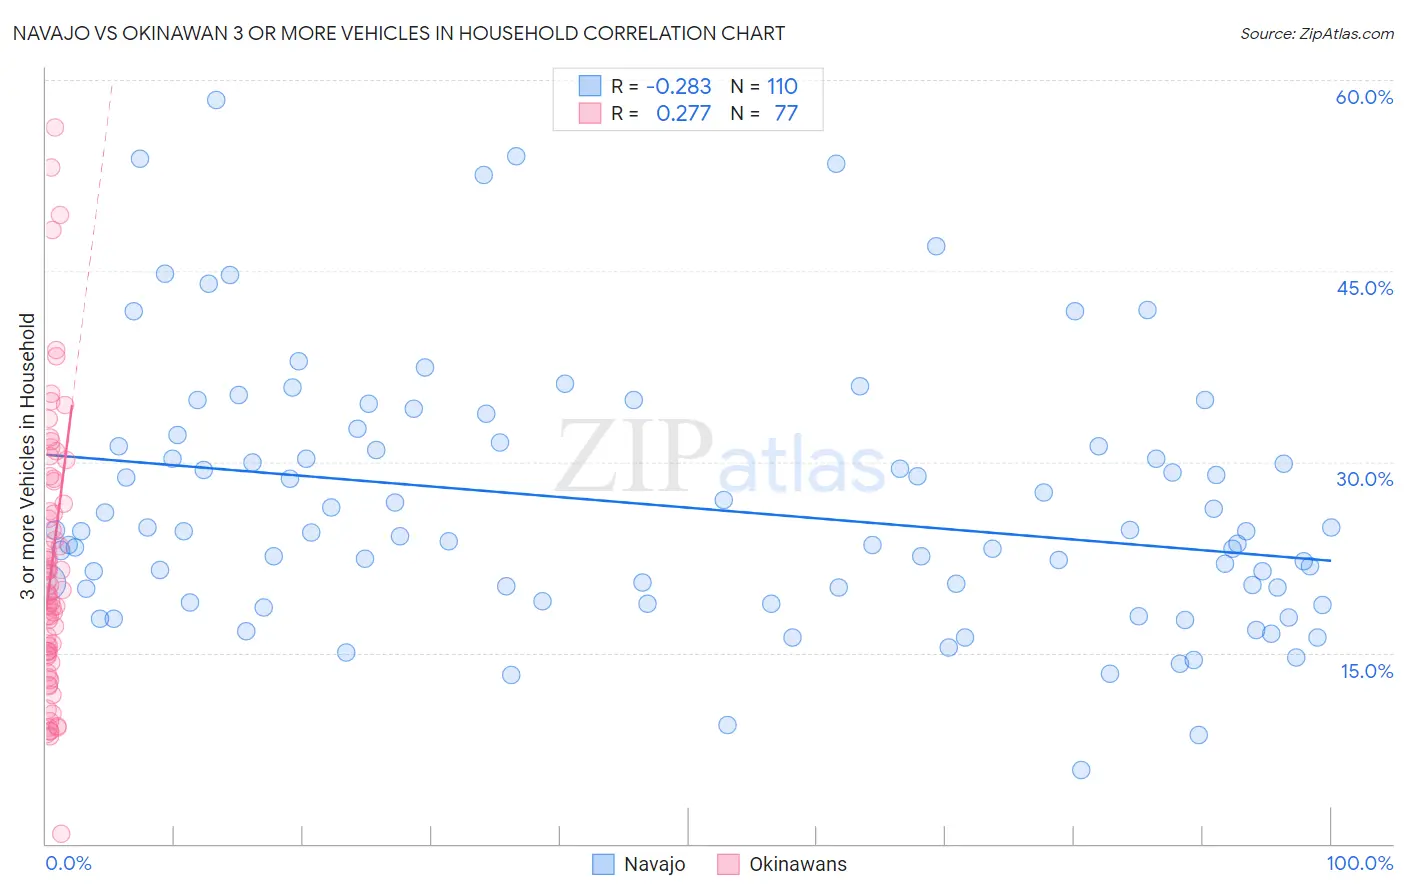
Navajo vs Okinawan 3 or more Vehicles in Household Correlation Chart
The statistical analysis conducted on geographies consisting of 224,733,620 people shows a weak negative correlation between the proportion of Navajo and percentage of households with 3 or more vehicles available in the United States with a correlation coefficient (R) of -0.283 and weighted average of 22.3%. Similarly, the statistical analysis conducted on geographies consisting of 73,703,163 people shows a weak positive correlation between the proportion of Okinawans and percentage of households with 3 or more vehicles available in the United States with a correlation coefficient (R) of 0.277 and weighted average of 17.4%, a difference of 27.8%.
3 or more Vehicles in Household Correlation Summary
| Measurement | Navajo | Okinawan |
| Minimum | 5.8% | 0.75% |
| Maximum | 58.5% | 56.2% |
| Range | 52.7% | 55.5% |
| Mean | 26.6% | 21.7% |
| Median | 24.5% | 19.5% |
| Interquartile 25% (IQ1) | 20.0% | 14.8% |
| Interquartile 75% (IQ3) | 31.2% | 27.6% |
| Interquartile Range (IQR) | 11.2% | 12.8% |
| Standard Deviation (Sample) | 10.2% | 10.7% |
| Standard Deviation (Population) | 10.1% | 10.6% |
Similar Demographics by 3 or more Vehicles in Household
Demographics Similar to Navajo by 3 or more Vehicles in Household
In terms of 3 or more vehicles in household, the demographic groups most similar to Navajo are Spaniard (22.3%, a difference of 0.060%), Finnish (22.3%, a difference of 0.090%), Pennsylvania German (22.3%, a difference of 0.19%), Bhutanese (22.2%, a difference of 0.24%), and Fijian (22.2%, a difference of 0.28%).
| Demographics | Rating | Rank | 3 or more Vehicles in Household |
| Welsh | 100.0 /100 | #52 | Exceptional 22.6% |
| Czechs | 100.0 /100 | #53 | Exceptional 22.5% |
| Crow | 100.0 /100 | #54 | Exceptional 22.5% |
| Immigrants | Laos | 100.0 /100 | #55 | Exceptional 22.4% |
| Hispanics or Latinos | 100.0 /100 | #56 | Exceptional 22.4% |
| Pennsylvania Germans | 100.0 /100 | #57 | Exceptional 22.3% |
| Spaniards | 100.0 /100 | #58 | Exceptional 22.3% |
| Navajo | 100.0 /100 | #59 | Exceptional 22.3% |
| Finns | 99.9 /100 | #60 | Exceptional 22.3% |
| Bhutanese | 99.9 /100 | #61 | Exceptional 22.2% |
| Fijians | 99.9 /100 | #62 | Exceptional 22.2% |
| Chickasaw | 99.9 /100 | #63 | Exceptional 22.2% |
| Immigrants | Taiwan | 99.9 /100 | #64 | Exceptional 22.1% |
| Pima | 99.9 /100 | #65 | Exceptional 22.0% |
| Northern Europeans | 99.9 /100 | #66 | Exceptional 22.0% |
Demographics Similar to Okinawans by 3 or more Vehicles in Household
In terms of 3 or more vehicles in household, the demographic groups most similar to Okinawans are Brazilian (17.4%, a difference of 0.14%), Immigrants from Ukraine (17.5%, a difference of 0.16%), Immigrants from Bahamas (17.4%, a difference of 0.23%), Immigrants from Kazakhstan (17.4%, a difference of 0.25%), and Immigrants from Eastern Europe (17.4%, a difference of 0.29%).
| Demographics | Rating | Rank | 3 or more Vehicles in Household |
| Immigrants | France | 0.6 /100 | #269 | Tragic 17.6% |
| Immigrants | Nepal | 0.6 /100 | #270 | Tragic 17.6% |
| South Americans | 0.6 /100 | #271 | Tragic 17.6% |
| Immigrants | Africa | 0.5 /100 | #272 | Tragic 17.6% |
| Immigrants | Sudan | 0.5 /100 | #273 | Tragic 17.6% |
| Immigrants | Bosnia and Herzegovina | 0.5 /100 | #274 | Tragic 17.5% |
| Immigrants | Ukraine | 0.4 /100 | #275 | Tragic 17.5% |
| Okinawans | 0.4 /100 | #276 | Tragic 17.4% |
| Brazilians | 0.4 /100 | #277 | Tragic 17.4% |
| Immigrants | Bahamas | 0.3 /100 | #278 | Tragic 17.4% |
| Immigrants | Kazakhstan | 0.3 /100 | #279 | Tragic 17.4% |
| Immigrants | Eastern Europe | 0.3 /100 | #280 | Tragic 17.4% |
| Immigrants | Latvia | 0.3 /100 | #281 | Tragic 17.4% |
| Immigrants | Ireland | 0.3 /100 | #282 | Tragic 17.3% |
| Blacks/African Americans | 0.3 /100 | #283 | Tragic 17.3% |