Navajo vs Lumbee Doctorate Degree
COMPARE
Navajo
Lumbee
Doctorate Degree
Doctorate Degree Comparison
Navajo
Lumbee
1.4%
DOCTORATE DEGREE
0.1/ 100
METRIC RATING
316th/ 347
METRIC RANK
1.1%
DOCTORATE DEGREE
0.0/ 100
METRIC RATING
345th/ 347
METRIC RANK
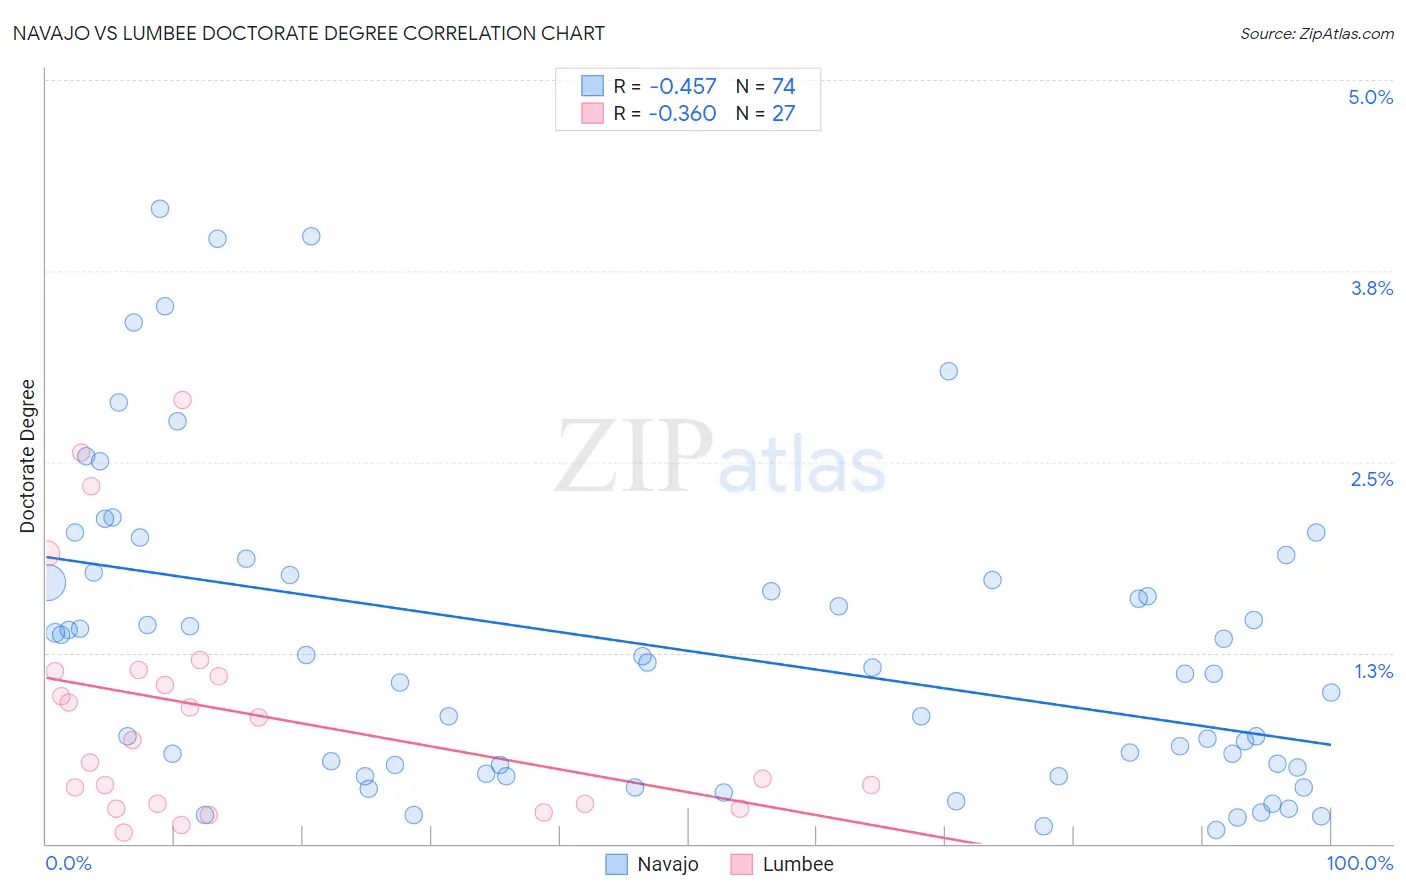
Navajo vs Lumbee Doctorate Degree Correlation Chart
The statistical analysis conducted on geographies consisting of 222,101,236 people shows a moderate negative correlation between the proportion of Navajo and percentage of population with at least doctorate degree education in the United States with a correlation coefficient (R) of -0.457 and weighted average of 1.4%. Similarly, the statistical analysis conducted on geographies consisting of 91,789,296 people shows a mild negative correlation between the proportion of Lumbee and percentage of population with at least doctorate degree education in the United States with a correlation coefficient (R) of -0.360 and weighted average of 1.1%, a difference of 24.0%.
Doctorate Degree Correlation Summary
| Measurement | Navajo | Lumbee |
| Minimum | 0.090% | 0.076% |
| Maximum | 4.2% | 2.9% |
| Range | 4.1% | 2.8% |
| Mean | 1.3% | 0.86% |
| Median | 1.1% | 0.68% |
| Interquartile 25% (IQ1) | 0.50% | 0.26% |
| Interquartile 75% (IQ3) | 1.8% | 1.1% |
| Interquartile Range (IQR) | 1.3% | 0.87% |
| Standard Deviation (Sample) | 1.0% | 0.77% |
| Standard Deviation (Population) | 1.00% | 0.75% |
Similar Demographics by Doctorate Degree
Demographics Similar to Navajo by Doctorate Degree
In terms of doctorate degree, the demographic groups most similar to Navajo are Immigrants from the Azores (1.4%, a difference of 0.21%), Dominican (1.4%, a difference of 0.23%), Immigrants from Micronesia (1.3%, a difference of 0.25%), Creek (1.3%, a difference of 0.30%), and Menominee (1.4%, a difference of 0.31%).
| Demographics | Rating | Rank | Doctorate Degree |
| Immigrants | Grenada | 0.1 /100 | #309 | Tragic 1.4% |
| Immigrants | Jamaica | 0.1 /100 | #310 | Tragic 1.4% |
| Immigrants | Honduras | 0.1 /100 | #311 | Tragic 1.4% |
| Immigrants | Nicaragua | 0.1 /100 | #312 | Tragic 1.4% |
| Menominee | 0.1 /100 | #313 | Tragic 1.4% |
| Dominicans | 0.1 /100 | #314 | Tragic 1.4% |
| Immigrants | Azores | 0.1 /100 | #315 | Tragic 1.4% |
| Navajo | 0.1 /100 | #316 | Tragic 1.4% |
| Immigrants | Micronesia | 0.1 /100 | #317 | Tragic 1.3% |
| Creek | 0.1 /100 | #318 | Tragic 1.3% |
| Immigrants | Guyana | 0.1 /100 | #319 | Tragic 1.3% |
| Immigrants | St. Vincent and the Grenadines | 0.1 /100 | #320 | Tragic 1.3% |
| Dutch West Indians | 0.1 /100 | #321 | Tragic 1.3% |
| Seminole | 0.1 /100 | #322 | Tragic 1.3% |
| Immigrants | Belize | 0.1 /100 | #323 | Tragic 1.3% |
Demographics Similar to Lumbee by Doctorate Degree
In terms of doctorate degree, the demographic groups most similar to Lumbee are Immigrants from Mexico (1.1%, a difference of 1.5%), Spanish American Indian (1.1%, a difference of 2.8%), Fijian (1.1%, a difference of 3.6%), Arapaho (1.2%, a difference of 7.1%), and Mexican (1.2%, a difference of 7.5%).
| Demographics | Rating | Rank | Doctorate Degree |
| Immigrants | Caribbean | 0.0 /100 | #333 | Tragic 1.3% |
| Immigrants | Dominican Republic | 0.0 /100 | #334 | Tragic 1.3% |
| Immigrants | Haiti | 0.0 /100 | #335 | Tragic 1.3% |
| Nepalese | 0.0 /100 | #336 | Tragic 1.3% |
| Bangladeshis | 0.0 /100 | #337 | Tragic 1.2% |
| Puget Sound Salish | 0.0 /100 | #338 | Tragic 1.2% |
| Immigrants | Central America | 0.0 /100 | #339 | Tragic 1.2% |
| Immigrants | Cuba | 0.0 /100 | #340 | Tragic 1.2% |
| Mexicans | 0.0 /100 | #341 | Tragic 1.2% |
| Arapaho | 0.0 /100 | #342 | Tragic 1.2% |
| Fijians | 0.0 /100 | #343 | Tragic 1.1% |
| Immigrants | Mexico | 0.0 /100 | #344 | Tragic 1.1% |
| Lumbee | 0.0 /100 | #345 | Tragic 1.1% |
| Spanish American Indians | 0.0 /100 | #346 | Tragic 1.1% |
| Houma | 0.0 /100 | #347 | Tragic 0.96% |