Native/Alaskan vs Yugoslavian Associate's Degree
COMPARE
Native/Alaskan
Yugoslavian
Associate's Degree
Associate's Degree Comparison
Natives/Alaskans
Yugoslavians
34.9%
ASSOCIATE'S DEGREE
0.0/ 100
METRIC RATING
334th/ 347
METRIC RANK
46.0%
ASSOCIATE'S DEGREE
40.2/ 100
METRIC RATING
183rd/ 347
METRIC RANK
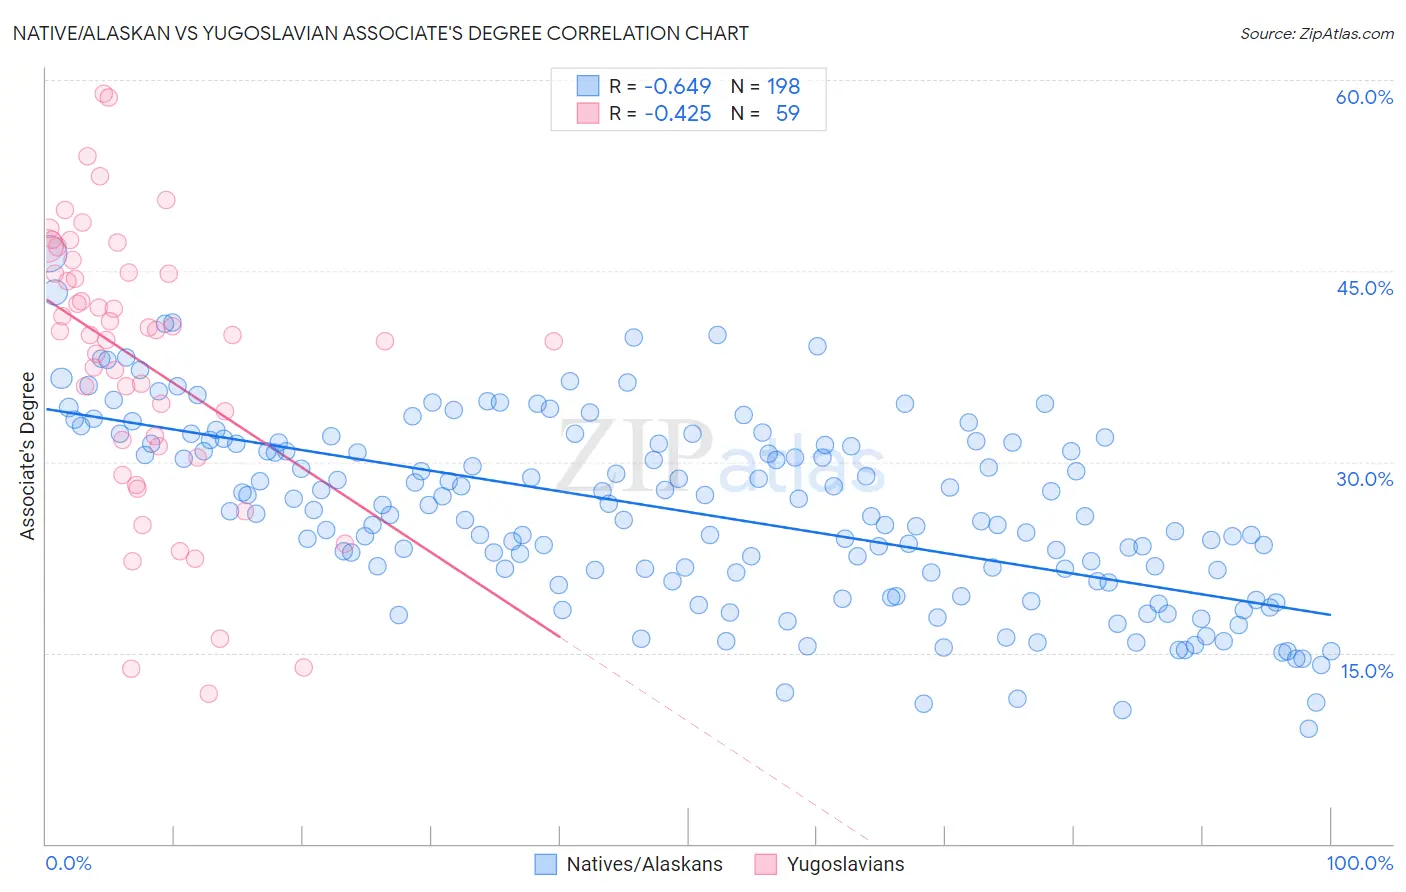
Native/Alaskan vs Yugoslavian Associate's Degree Correlation Chart
The statistical analysis conducted on geographies consisting of 513,021,509 people shows a significant negative correlation between the proportion of Natives/Alaskans and percentage of population with at least associate's degree education in the United States with a correlation coefficient (R) of -0.649 and weighted average of 34.9%. Similarly, the statistical analysis conducted on geographies consisting of 285,717,072 people shows a moderate negative correlation between the proportion of Yugoslavians and percentage of population with at least associate's degree education in the United States with a correlation coefficient (R) of -0.425 and weighted average of 46.0%, a difference of 31.8%.
Associate's Degree Correlation Summary
| Measurement | Native/Alaskan | Yugoslavian |
| Minimum | 9.1% | 11.8% |
| Maximum | 46.4% | 58.9% |
| Range | 37.3% | 47.2% |
| Mean | 26.1% | 37.9% |
| Median | 26.1% | 40.0% |
| Interquartile 25% (IQ1) | 21.3% | 31.3% |
| Interquartile 75% (IQ3) | 31.5% | 44.9% |
| Interquartile Range (IQR) | 10.2% | 13.6% |
| Standard Deviation (Sample) | 7.2% | 10.8% |
| Standard Deviation (Population) | 7.2% | 10.7% |
Similar Demographics by Associate's Degree
Demographics Similar to Natives/Alaskans by Associate's Degree
In terms of associate's degree, the demographic groups most similar to Natives/Alaskans are Spanish American Indian (34.9%, a difference of 0.14%), Mexican (35.0%, a difference of 0.24%), Immigrants from Central America (35.0%, a difference of 0.31%), Hopi (34.6%, a difference of 1.0%), and Immigrants from the Azores (35.6%, a difference of 2.1%).
| Demographics | Rating | Rank | Associate's Degree |
| Dutch West Indians | 0.0 /100 | #327 | Tragic 36.5% |
| Alaskan Athabascans | 0.0 /100 | #328 | Tragic 36.5% |
| Paiute | 0.0 /100 | #329 | Tragic 36.4% |
| Apache | 0.0 /100 | #330 | Tragic 36.2% |
| Immigrants | Azores | 0.0 /100 | #331 | Tragic 35.6% |
| Immigrants | Central America | 0.0 /100 | #332 | Tragic 35.0% |
| Mexicans | 0.0 /100 | #333 | Tragic 35.0% |
| Natives/Alaskans | 0.0 /100 | #334 | Tragic 34.9% |
| Spanish American Indians | 0.0 /100 | #335 | Tragic 34.9% |
| Hopi | 0.0 /100 | #336 | Tragic 34.6% |
| Lumbee | 0.0 /100 | #337 | Tragic 34.1% |
| Pueblo | 0.0 /100 | #338 | Tragic 34.0% |
| Immigrants | Mexico | 0.0 /100 | #339 | Tragic 33.7% |
| Navajo | 0.0 /100 | #340 | Tragic 32.6% |
| Inupiat | 0.0 /100 | #341 | Tragic 32.6% |
Demographics Similar to Yugoslavians by Associate's Degree
In terms of associate's degree, the demographic groups most similar to Yugoslavians are Swiss (46.0%, a difference of 0.010%), Czechoslovakian (46.0%, a difference of 0.020%), Immigrants from Colombia (46.0%, a difference of 0.080%), Costa Rican (46.0%, a difference of 0.13%), and Welsh (45.9%, a difference of 0.19%).
| Demographics | Rating | Rank | Associate's Degree |
| Finns | 48.5 /100 | #176 | Average 46.3% |
| Slovaks | 48.4 /100 | #177 | Average 46.3% |
| Immigrants | Bosnia and Herzegovina | 48.3 /100 | #178 | Average 46.3% |
| Sri Lankans | 47.6 /100 | #179 | Average 46.3% |
| Bermudans | 46.4 /100 | #180 | Average 46.2% |
| Immigrants | Colombia | 41.3 /100 | #181 | Average 46.0% |
| Swiss | 40.4 /100 | #182 | Average 46.0% |
| Yugoslavians | 40.2 /100 | #183 | Average 46.0% |
| Czechoslovakians | 40.0 /100 | #184 | Average 46.0% |
| Costa Ricans | 38.6 /100 | #185 | Fair 46.0% |
| Welsh | 37.9 /100 | #186 | Fair 45.9% |
| Immigrants | Uruguay | 35.5 /100 | #187 | Fair 45.8% |
| Ghanaians | 35.5 /100 | #188 | Fair 45.8% |
| Immigrants | Oceania | 34.7 /100 | #189 | Fair 45.8% |
| Vietnamese | 34.0 /100 | #190 | Fair 45.8% |