Native/Alaskan vs Yugoslavian In Labor Force | Age 45-54
COMPARE
Native/Alaskan
Yugoslavian
In Labor Force | Age 45-54
In Labor Force | Age 45-54 Comparison
Natives/Alaskans
Yugoslavians
77.1%
IN LABOR FORCE | AGE 45-54
0.0/ 100
METRIC RATING
333rd/ 347
METRIC RANK
83.0%
IN LABOR FORCE | AGE 45-54
78.3/ 100
METRIC RATING
140th/ 347
METRIC RANK
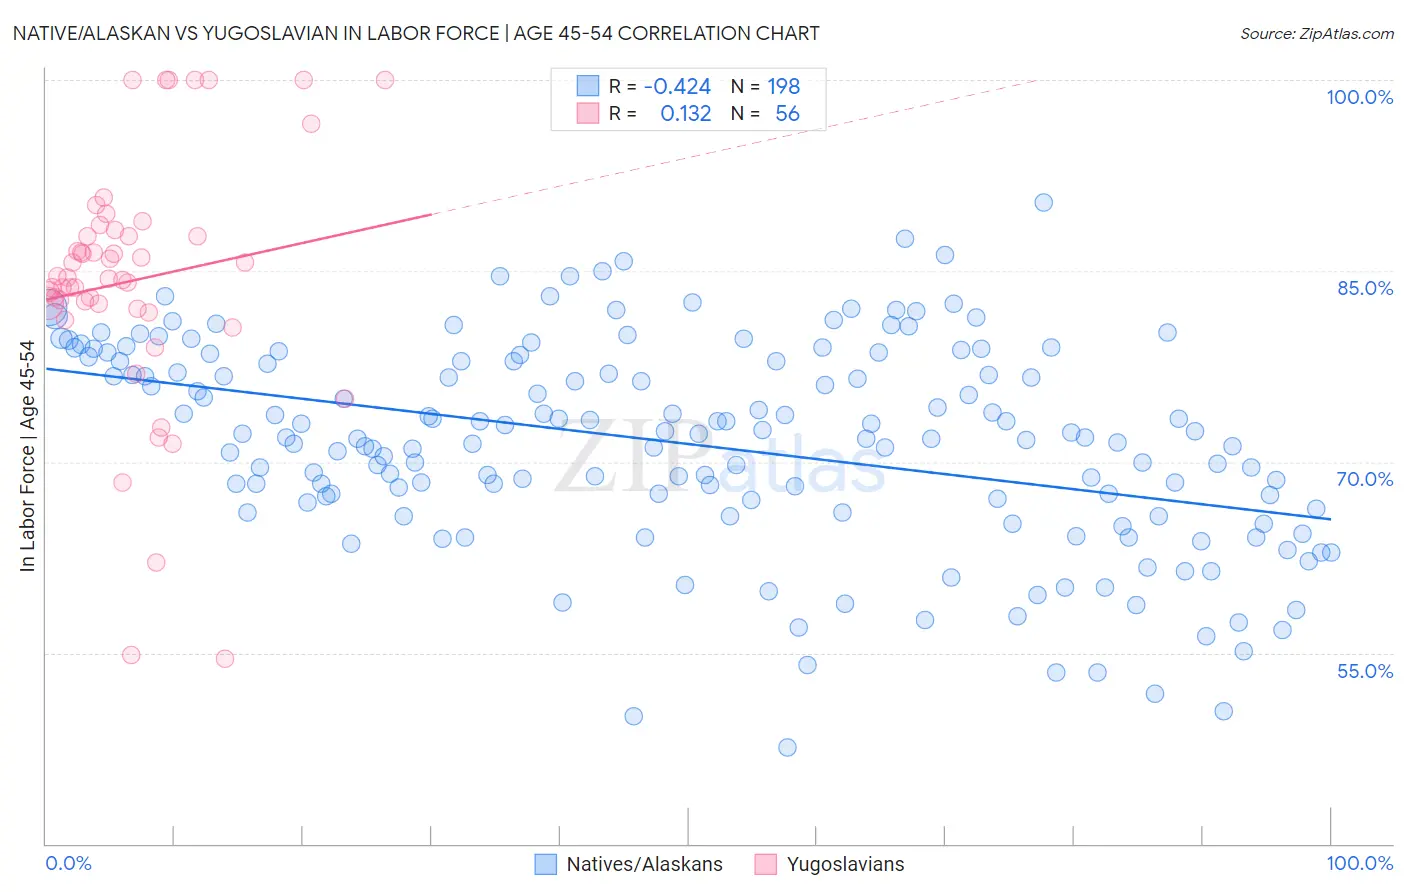
Native/Alaskan vs Yugoslavian In Labor Force | Age 45-54 Correlation Chart
The statistical analysis conducted on geographies consisting of 512,575,279 people shows a moderate negative correlation between the proportion of Natives/Alaskans and labor force participation rate among population between the ages 45 and 54 in the United States with a correlation coefficient (R) of -0.424 and weighted average of 77.1%. Similarly, the statistical analysis conducted on geographies consisting of 285,617,404 people shows a poor positive correlation between the proportion of Yugoslavians and labor force participation rate among population between the ages 45 and 54 in the United States with a correlation coefficient (R) of 0.132 and weighted average of 83.0%, a difference of 7.6%.
In Labor Force | Age 45-54 Correlation Summary
| Measurement | Native/Alaskan | Yugoslavian |
| Minimum | 47.6% | 54.5% |
| Maximum | 90.4% | 100.0% |
| Range | 42.8% | 45.5% |
| Mean | 71.4% | 84.3% |
| Median | 72.0% | 84.4% |
| Interquartile 25% (IQ1) | 66.8% | 82.2% |
| Interquartile 75% (IQ3) | 77.9% | 88.0% |
| Interquartile Range (IQR) | 11.1% | 5.8% |
| Standard Deviation (Sample) | 8.1% | 9.8% |
| Standard Deviation (Population) | 8.1% | 9.7% |
Similar Demographics by In Labor Force | Age 45-54
Demographics Similar to Natives/Alaskans by In Labor Force | Age 45-54
In terms of in labor force | age 45-54, the demographic groups most similar to Natives/Alaskans are Apache (77.1%, a difference of 0.0%), Arapaho (77.1%, a difference of 0.070%), Menominee (77.4%, a difference of 0.36%), Tsimshian (77.4%, a difference of 0.39%), and Cheyenne (77.6%, a difference of 0.54%).
| Demographics | Rating | Rank | In Labor Force | Age 45-54 |
| Seminole | 0.0 /100 | #326 | Tragic 78.1% |
| Cajuns | 0.0 /100 | #327 | Tragic 78.1% |
| Sioux | 0.0 /100 | #328 | Tragic 78.0% |
| Creek | 0.0 /100 | #329 | Tragic 77.7% |
| Cheyenne | 0.0 /100 | #330 | Tragic 77.6% |
| Tsimshian | 0.0 /100 | #331 | Tragic 77.4% |
| Menominee | 0.0 /100 | #332 | Tragic 77.4% |
| Natives/Alaskans | 0.0 /100 | #333 | Tragic 77.1% |
| Apache | 0.0 /100 | #334 | Tragic 77.1% |
| Arapaho | 0.0 /100 | #335 | Tragic 77.1% |
| Paiute | 0.0 /100 | #336 | Tragic 76.7% |
| Ute | 0.0 /100 | #337 | Tragic 76.6% |
| Yuman | 0.0 /100 | #338 | Tragic 76.3% |
| Puerto Ricans | 0.0 /100 | #339 | Tragic 75.9% |
| Lumbee | 0.0 /100 | #340 | Tragic 75.6% |
Demographics Similar to Yugoslavians by In Labor Force | Age 45-54
In terms of in labor force | age 45-54, the demographic groups most similar to Yugoslavians are Scandinavian (83.0%, a difference of 0.0%), Immigrants from Haiti (83.0%, a difference of 0.010%), Immigrants from Scotland (83.0%, a difference of 0.010%), Ghanaian (83.0%, a difference of 0.020%), and Okinawan (83.0%, a difference of 0.020%).
| Demographics | Rating | Rank | In Labor Force | Age 45-54 |
| Liberians | 82.7 /100 | #133 | Excellent 83.0% |
| Sudanese | 82.0 /100 | #134 | Excellent 83.0% |
| Austrians | 81.3 /100 | #135 | Excellent 83.0% |
| Immigrants | Kazakhstan | 81.0 /100 | #136 | Excellent 83.0% |
| Immigrants | Spain | 80.4 /100 | #137 | Excellent 83.0% |
| Ghanaians | 79.5 /100 | #138 | Good 83.0% |
| Scandinavians | 78.5 /100 | #139 | Good 83.0% |
| Yugoslavians | 78.3 /100 | #140 | Good 83.0% |
| Immigrants | Haiti | 77.9 /100 | #141 | Good 83.0% |
| Immigrants | Scotland | 77.8 /100 | #142 | Good 83.0% |
| Okinawans | 77.0 /100 | #143 | Good 83.0% |
| Soviet Union | 76.8 /100 | #144 | Good 83.0% |
| Romanians | 75.4 /100 | #145 | Good 83.0% |
| Immigrants | France | 75.3 /100 | #146 | Good 83.0% |
| Czechoslovakians | 74.8 /100 | #147 | Good 83.0% |