Native/Alaskan vs Yugoslavian In Labor Force | Age 20-64
COMPARE
Native/Alaskan
Yugoslavian
In Labor Force | Age 20-64
In Labor Force | Age 20-64 Comparison
Natives/Alaskans
Yugoslavians
73.9%
IN LABOR FORCE | AGE 20-64
0.0/ 100
METRIC RATING
333rd/ 347
METRIC RANK
80.1%
IN LABOR FORCE | AGE 20-64
95.9/ 100
METRIC RATING
95th/ 347
METRIC RANK
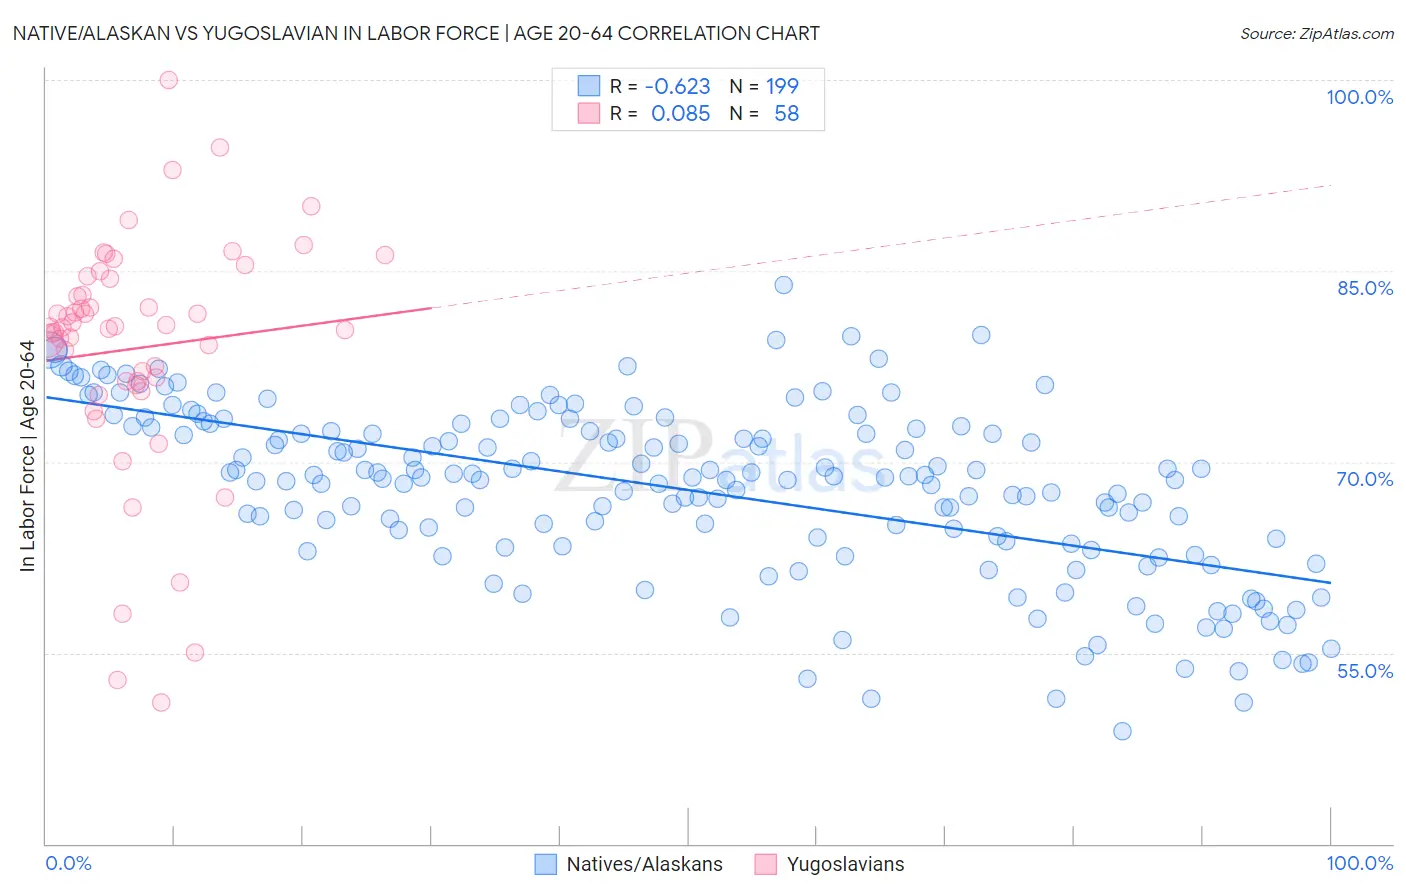
Native/Alaskan vs Yugoslavian In Labor Force | Age 20-64 Correlation Chart
The statistical analysis conducted on geographies consisting of 513,028,645 people shows a significant negative correlation between the proportion of Natives/Alaskans and labor force participation rate among population between the ages 20 and 64 in the United States with a correlation coefficient (R) of -0.623 and weighted average of 73.9%. Similarly, the statistical analysis conducted on geographies consisting of 285,716,744 people shows a slight positive correlation between the proportion of Yugoslavians and labor force participation rate among population between the ages 20 and 64 in the United States with a correlation coefficient (R) of 0.085 and weighted average of 80.1%, a difference of 8.3%.
In Labor Force | Age 20-64 Correlation Summary
| Measurement | Native/Alaskan | Yugoslavian |
| Minimum | 48.8% | 51.1% |
| Maximum | 83.9% | 100.0% |
| Range | 35.1% | 48.9% |
| Mean | 67.8% | 78.9% |
| Median | 68.8% | 80.5% |
| Interquartile 25% (IQ1) | 63.6% | 76.3% |
| Interquartile 75% (IQ3) | 72.7% | 84.3% |
| Interquartile Range (IQR) | 9.2% | 8.0% |
| Standard Deviation (Sample) | 6.8% | 9.4% |
| Standard Deviation (Population) | 6.8% | 9.3% |
Similar Demographics by In Labor Force | Age 20-64
Demographics Similar to Natives/Alaskans by In Labor Force | Age 20-64
In terms of in labor force | age 20-64, the demographic groups most similar to Natives/Alaskans are Apache (73.7%, a difference of 0.30%), Ute (73.7%, a difference of 0.32%), Arapaho (74.4%, a difference of 0.66%), Crow (73.3%, a difference of 0.83%), and Yup'ik (73.2%, a difference of 0.95%).
| Demographics | Rating | Rank | In Labor Force | Age 20-64 |
| Creek | 0.0 /100 | #326 | Tragic 75.1% |
| Sioux | 0.0 /100 | #327 | Tragic 75.0% |
| Kiowa | 0.0 /100 | #328 | Tragic 75.0% |
| Cheyenne | 0.0 /100 | #329 | Tragic 74.8% |
| Colville | 0.0 /100 | #330 | Tragic 74.8% |
| Paiute | 0.0 /100 | #331 | Tragic 74.7% |
| Arapaho | 0.0 /100 | #332 | Tragic 74.4% |
| Natives/Alaskans | 0.0 /100 | #333 | Tragic 73.9% |
| Apache | 0.0 /100 | #334 | Tragic 73.7% |
| Ute | 0.0 /100 | #335 | Tragic 73.7% |
| Crow | 0.0 /100 | #336 | Tragic 73.3% |
| Yup'ik | 0.0 /100 | #337 | Tragic 73.2% |
| Puerto Ricans | 0.0 /100 | #338 | Tragic 73.1% |
| Houma | 0.0 /100 | #339 | Tragic 72.7% |
| Pueblo | 0.0 /100 | #340 | Tragic 72.6% |
Demographics Similar to Yugoslavians by In Labor Force | Age 20-64
In terms of in labor force | age 20-64, the demographic groups most similar to Yugoslavians are Immigrants from Malaysia (80.1%, a difference of 0.0%), South American (80.1%, a difference of 0.0%), Immigrants from Uruguay (80.1%, a difference of 0.0%), Immigrants from Asia (80.1%, a difference of 0.010%), and Immigrants from Chile (80.1%, a difference of 0.010%).
| Demographics | Rating | Rank | In Labor Force | Age 20-64 |
| Chileans | 97.0 /100 | #88 | Exceptional 80.1% |
| Immigrants | Venezuela | 96.8 /100 | #89 | Exceptional 80.1% |
| Poles | 96.8 /100 | #90 | Exceptional 80.1% |
| Uruguayans | 96.7 /100 | #91 | Exceptional 80.1% |
| Ghanaians | 96.7 /100 | #92 | Exceptional 80.1% |
| Immigrants | Belarus | 96.4 /100 | #93 | Exceptional 80.1% |
| Immigrants | Asia | 96.0 /100 | #94 | Exceptional 80.1% |
| Yugoslavians | 95.9 /100 | #95 | Exceptional 80.1% |
| Immigrants | Malaysia | 95.9 /100 | #96 | Exceptional 80.1% |
| South Americans | 95.9 /100 | #97 | Exceptional 80.1% |
| Immigrants | Uruguay | 95.8 /100 | #98 | Exceptional 80.1% |
| Immigrants | Chile | 95.7 /100 | #99 | Exceptional 80.1% |
| Filipinos | 95.6 /100 | #100 | Exceptional 80.1% |
| Palestinians | 95.5 /100 | #101 | Exceptional 80.0% |
| Immigrants | Australia | 95.5 /100 | #102 | Exceptional 80.0% |