Immigrants from Central America vs Yugoslavian No Vehicles in Household
COMPARE
Immigrants from Central America
Yugoslavian
No Vehicles in Household
No Vehicles in Household Comparison
Immigrants from Central America
Yugoslavians
8.9%
NO VEHICLES IN HOUSEHOLD
98.5/ 100
METRIC RATING
97th/ 347
METRIC RANK
9.0%
NO VEHICLES IN HOUSEHOLD
98.3/ 100
METRIC RATING
102nd/ 347
METRIC RANK
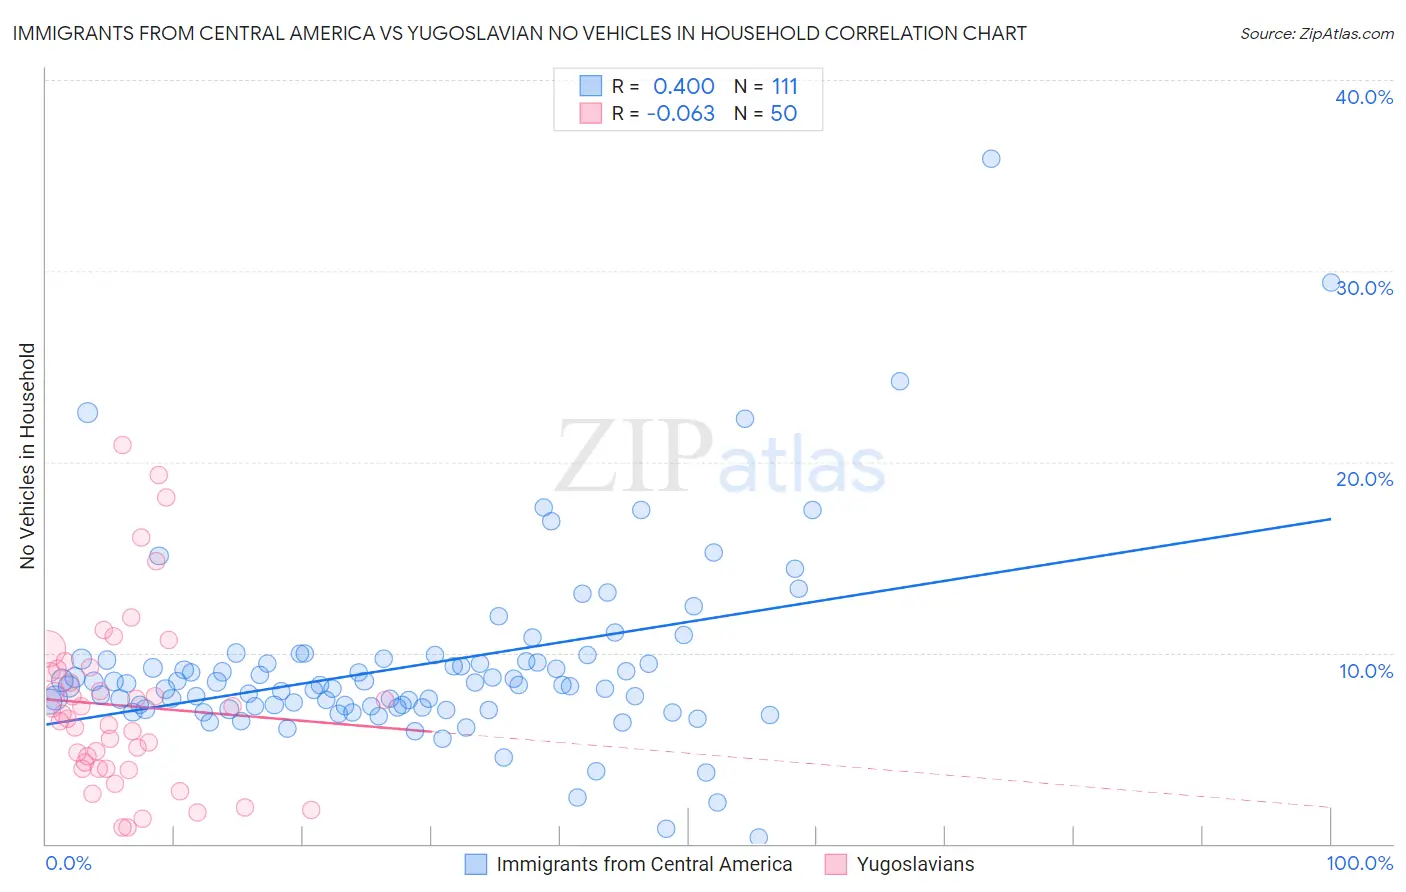
Immigrants from Central America vs Yugoslavian No Vehicles in Household Correlation Chart
The statistical analysis conducted on geographies consisting of 533,101,389 people shows a moderate positive correlation between the proportion of Immigrants from Central America and percentage of households with no vehicle available in the United States with a correlation coefficient (R) of 0.400 and weighted average of 8.9%. Similarly, the statistical analysis conducted on geographies consisting of 285,290,646 people shows a slight negative correlation between the proportion of Yugoslavians and percentage of households with no vehicle available in the United States with a correlation coefficient (R) of -0.063 and weighted average of 9.0%, a difference of 0.63%.
No Vehicles in Household Correlation Summary
| Measurement | Immigrants from Central America | Yugoslavian |
| Minimum | 0.36% | 0.84% |
| Maximum | 35.8% | 20.9% |
| Range | 35.5% | 20.0% |
| Mean | 9.3% | 7.2% |
| Median | 8.3% | 6.7% |
| Interquartile 25% (IQ1) | 7.1% | 3.9% |
| Interquartile 75% (IQ3) | 9.6% | 9.1% |
| Interquartile Range (IQR) | 2.5% | 5.2% |
| Standard Deviation (Sample) | 4.9% | 4.6% |
| Standard Deviation (Population) | 4.9% | 4.5% |
Demographics Similar to Immigrants from Central America and Yugoslavians by No Vehicles in Household
In terms of no vehicles in household, the demographic groups most similar to Immigrants from Central America are Slavic (9.0%, a difference of 0.31%), Bulgarian (9.0%, a difference of 0.36%), Asian (9.0%, a difference of 0.55%), Pakistani (9.0%, a difference of 0.59%), and Seminole (9.0%, a difference of 0.63%). Similarly, the demographic groups most similar to Yugoslavians are Seminole (9.0%, a difference of 0.0%), Pakistani (9.0%, a difference of 0.050%), Asian (9.0%, a difference of 0.080%), Bulgarian (9.0%, a difference of 0.27%), and Slavic (9.0%, a difference of 0.32%).
| Demographics | Rating | Rank | No Vehicles in Household |
| Immigrants | Cuba | 99.2 /100 | #89 | Exceptional 8.7% |
| Bhutanese | 99.2 /100 | #90 | Exceptional 8.7% |
| Immigrants | Germany | 99.1 /100 | #91 | Exceptional 8.7% |
| Immigrants | Canada | 99.1 /100 | #92 | Exceptional 8.7% |
| Immigrants | North America | 99.1 /100 | #93 | Exceptional 8.7% |
| Austrians | 98.9 /100 | #94 | Exceptional 8.8% |
| Potawatomi | 98.8 /100 | #95 | Exceptional 8.8% |
| Immigrants | Bolivia | 98.7 /100 | #96 | Exceptional 8.9% |
| Immigrants | Central America | 98.5 /100 | #97 | Exceptional 8.9% |
| Slavs | 98.4 /100 | #98 | Exceptional 9.0% |
| Bulgarians | 98.4 /100 | #99 | Exceptional 9.0% |
| Asians | 98.3 /100 | #100 | Exceptional 9.0% |
| Pakistanis | 98.3 /100 | #101 | Exceptional 9.0% |
| Yugoslavians | 98.3 /100 | #102 | Exceptional 9.0% |
| Seminole | 98.3 /100 | #103 | Exceptional 9.0% |
| Zimbabweans | 98.0 /100 | #104 | Exceptional 9.0% |
| Spanish Americans | 97.9 /100 | #105 | Exceptional 9.1% |
| Laotians | 97.8 /100 | #106 | Exceptional 9.1% |
| Hispanics or Latinos | 97.7 /100 | #107 | Exceptional 9.1% |
| Mexican American Indians | 97.6 /100 | #108 | Exceptional 9.1% |
| Maltese | 97.6 /100 | #109 | Exceptional 9.1% |