Moroccan vs Yugoslavian No Vehicles in Household
COMPARE
Moroccan
Yugoslavian
No Vehicles in Household
No Vehicles in Household Comparison
Moroccans
Yugoslavians
14.7%
NO VEHICLES IN HOUSEHOLD
0.0/ 100
METRIC RATING
298th/ 347
METRIC RANK
9.0%
NO VEHICLES IN HOUSEHOLD
98.3/ 100
METRIC RATING
102nd/ 347
METRIC RANK
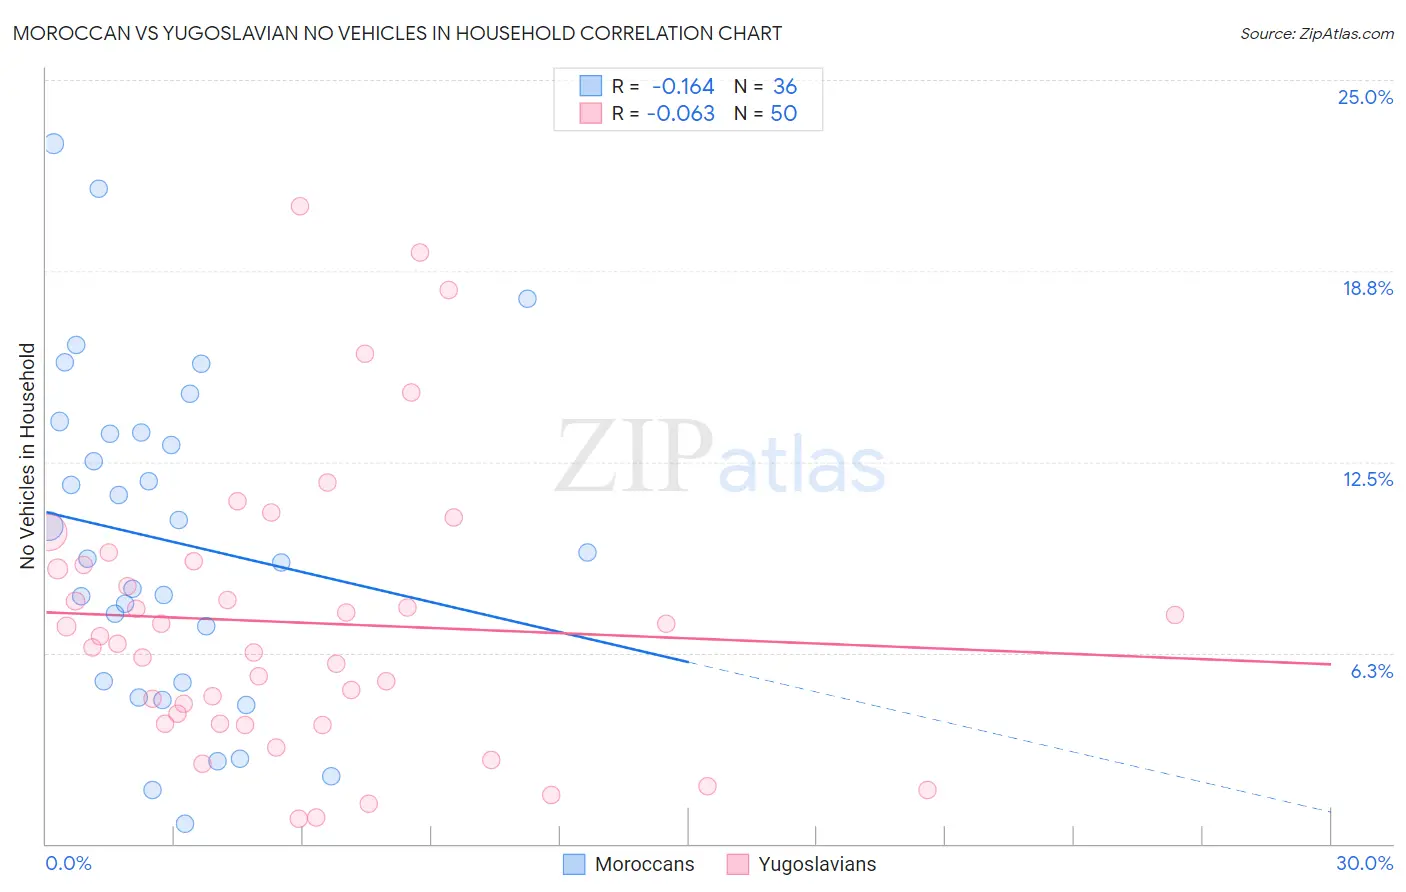
Moroccan vs Yugoslavian No Vehicles in Household Correlation Chart
The statistical analysis conducted on geographies consisting of 201,657,116 people shows a poor negative correlation between the proportion of Moroccans and percentage of households with no vehicle available in the United States with a correlation coefficient (R) of -0.164 and weighted average of 14.7%. Similarly, the statistical analysis conducted on geographies consisting of 285,290,646 people shows a slight negative correlation between the proportion of Yugoslavians and percentage of households with no vehicle available in the United States with a correlation coefficient (R) of -0.063 and weighted average of 9.0%, a difference of 63.3%.
No Vehicles in Household Correlation Summary
| Measurement | Moroccan | Yugoslavian |
| Minimum | 0.64% | 0.84% |
| Maximum | 22.9% | 20.9% |
| Range | 22.3% | 20.0% |
| Mean | 9.9% | 7.2% |
| Median | 9.4% | 6.7% |
| Interquartile 25% (IQ1) | 5.3% | 3.9% |
| Interquartile 75% (IQ3) | 13.4% | 9.1% |
| Interquartile Range (IQR) | 8.2% | 5.2% |
| Standard Deviation (Sample) | 5.4% | 4.6% |
| Standard Deviation (Population) | 5.4% | 4.5% |
Similar Demographics by No Vehicles in Household
Demographics Similar to Moroccans by No Vehicles in Household
In terms of no vehicles in household, the demographic groups most similar to Moroccans are Immigrants from Panama (14.6%, a difference of 0.15%), Immigrants from Greece (14.7%, a difference of 0.20%), Immigrants from Spain (14.5%, a difference of 0.82%), Yuman (14.9%, a difference of 1.3%), and Immigrants from Ukraine (14.9%, a difference of 1.3%).
| Demographics | Rating | Rank | No Vehicles in Household |
| Okinawans | 0.0 /100 | #291 | Tragic 14.1% |
| Pima | 0.0 /100 | #292 | Tragic 14.1% |
| Immigrants | Jamaica | 0.0 /100 | #293 | Tragic 14.2% |
| Belizeans | 0.0 /100 | #294 | Tragic 14.3% |
| Paraguayans | 0.0 /100 | #295 | Tragic 14.4% |
| Immigrants | Spain | 0.0 /100 | #296 | Tragic 14.5% |
| Immigrants | Panama | 0.0 /100 | #297 | Tragic 14.6% |
| Moroccans | 0.0 /100 | #298 | Tragic 14.7% |
| Immigrants | Greece | 0.0 /100 | #299 | Tragic 14.7% |
| Yuman | 0.0 /100 | #300 | Tragic 14.9% |
| Immigrants | Ukraine | 0.0 /100 | #301 | Tragic 14.9% |
| Haitians | 0.0 /100 | #302 | Tragic 14.9% |
| Immigrants | Western Africa | 0.0 /100 | #303 | Tragic 15.0% |
| Immigrants | Russia | 0.0 /100 | #304 | Tragic 15.1% |
| Immigrants | China | 0.0 /100 | #305 | Tragic 15.2% |
Demographics Similar to Yugoslavians by No Vehicles in Household
In terms of no vehicles in household, the demographic groups most similar to Yugoslavians are Seminole (9.0%, a difference of 0.0%), Pakistani (9.0%, a difference of 0.050%), Asian (9.0%, a difference of 0.080%), Bulgarian (9.0%, a difference of 0.27%), and Slavic (9.0%, a difference of 0.32%).
| Demographics | Rating | Rank | No Vehicles in Household |
| Potawatomi | 98.8 /100 | #95 | Exceptional 8.8% |
| Immigrants | Bolivia | 98.7 /100 | #96 | Exceptional 8.9% |
| Immigrants | Central America | 98.5 /100 | #97 | Exceptional 8.9% |
| Slavs | 98.4 /100 | #98 | Exceptional 9.0% |
| Bulgarians | 98.4 /100 | #99 | Exceptional 9.0% |
| Asians | 98.3 /100 | #100 | Exceptional 9.0% |
| Pakistanis | 98.3 /100 | #101 | Exceptional 9.0% |
| Yugoslavians | 98.3 /100 | #102 | Exceptional 9.0% |
| Seminole | 98.3 /100 | #103 | Exceptional 9.0% |
| Zimbabweans | 98.0 /100 | #104 | Exceptional 9.0% |
| Spanish Americans | 97.9 /100 | #105 | Exceptional 9.1% |
| Laotians | 97.8 /100 | #106 | Exceptional 9.1% |
| Hispanics or Latinos | 97.7 /100 | #107 | Exceptional 9.1% |
| Mexican American Indians | 97.6 /100 | #108 | Exceptional 9.1% |
| Maltese | 97.6 /100 | #109 | Exceptional 9.1% |