Assyrian/Chaldean/Syriac vs Immigrants from Uruguay No Vehicles in Household
COMPARE
Assyrian/Chaldean/Syriac
Immigrants from Uruguay
No Vehicles in Household
No Vehicles in Household Comparison
Assyrians/Chaldeans/Syriacs
Immigrants from Uruguay
7.0%
NO VEHICLES IN HOUSEHOLD
100.0/ 100
METRIC RATING
12th/ 347
METRIC RANK
11.9%
NO VEHICLES IN HOUSEHOLD
1.3/ 100
METRIC RATING
254th/ 347
METRIC RANK
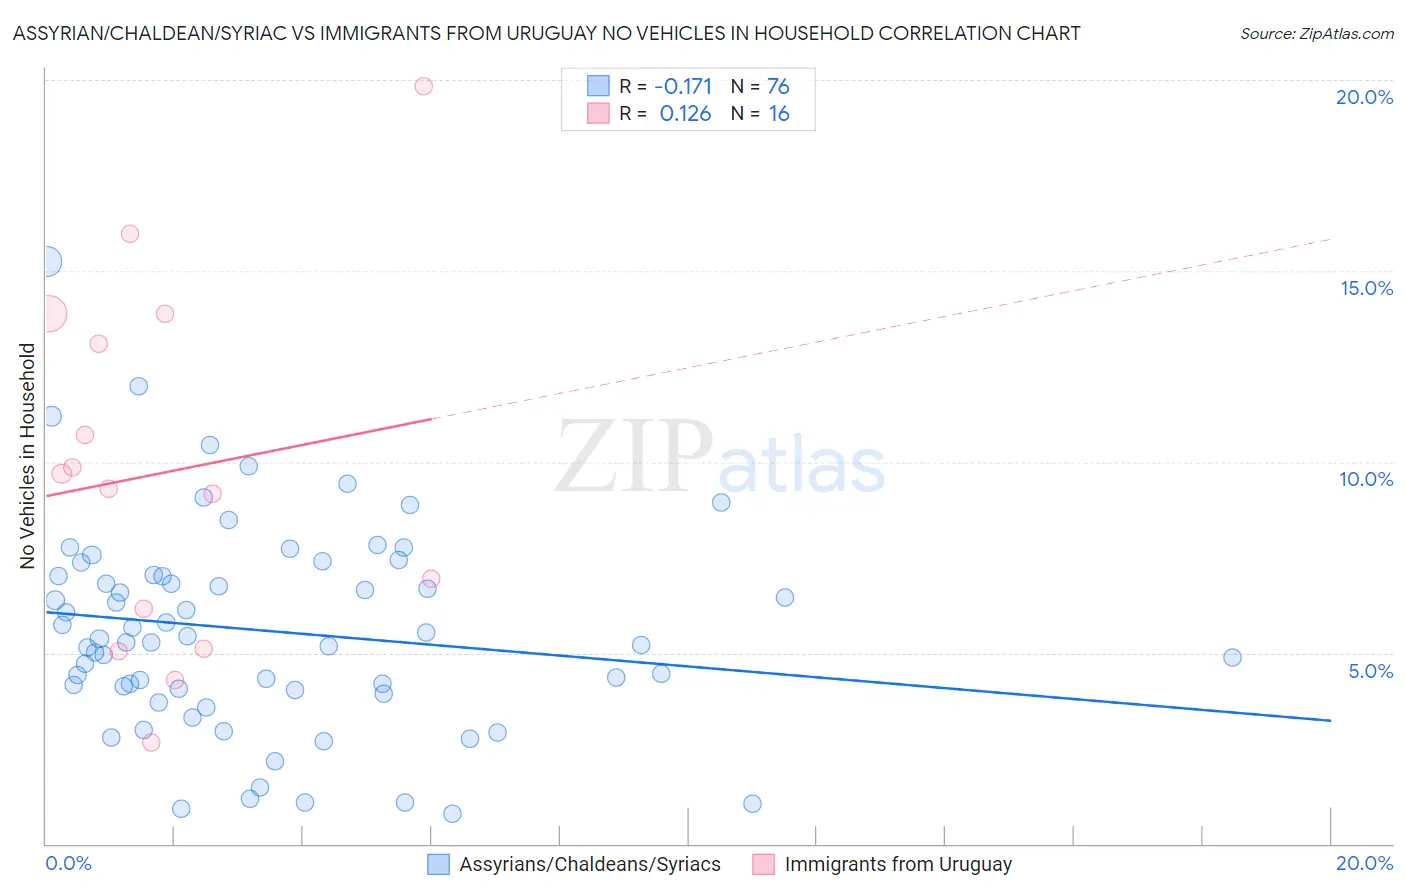
Assyrian/Chaldean/Syriac vs Immigrants from Uruguay No Vehicles in Household Correlation Chart
The statistical analysis conducted on geographies consisting of 110,265,900 people shows a poor negative correlation between the proportion of Assyrians/Chaldeans/Syriacs and percentage of households with no vehicle available in the United States with a correlation coefficient (R) of -0.171 and weighted average of 7.0%. Similarly, the statistical analysis conducted on geographies consisting of 133,161,139 people shows a poor positive correlation between the proportion of Immigrants from Uruguay and percentage of households with no vehicle available in the United States with a correlation coefficient (R) of 0.126 and weighted average of 11.9%, a difference of 71.0%.
No Vehicles in Household Correlation Summary
| Measurement | Assyrian/Chaldean/Syriac | Immigrants from Uruguay |
| Minimum | 0.78% | 2.7% |
| Maximum | 15.3% | 19.8% |
| Range | 14.5% | 17.2% |
| Mean | 5.6% | 9.7% |
| Median | 5.3% | 9.5% |
| Interquartile 25% (IQ1) | 4.0% | 5.6% |
| Interquartile 75% (IQ3) | 7.0% | 13.5% |
| Interquartile Range (IQR) | 3.0% | 7.9% |
| Standard Deviation (Sample) | 2.7% | 4.7% |
| Standard Deviation (Population) | 2.7% | 4.6% |
Similar Demographics by No Vehicles in Household
Demographics Similar to Assyrians/Chaldeans/Syriacs by No Vehicles in Household
In terms of no vehicles in household, the demographic groups most similar to Assyrians/Chaldeans/Syriacs are Scandinavian (7.0%, a difference of 0.50%), Mexican (7.0%, a difference of 0.67%), White/Caucasian (7.0%, a difference of 0.80%), Czech (6.9%, a difference of 1.4%), and European (7.1%, a difference of 2.0%).
| Demographics | Rating | Rank | No Vehicles in Household |
| Yakama | 100.0 /100 | #5 | Exceptional 6.6% |
| Germans | 100.0 /100 | #6 | Exceptional 6.7% |
| Scottish | 100.0 /100 | #7 | Exceptional 6.8% |
| Swedes | 100.0 /100 | #8 | Exceptional 6.8% |
| Scotch-Irish | 100.0 /100 | #9 | Exceptional 6.8% |
| Dutch | 100.0 /100 | #10 | Exceptional 6.8% |
| Czechs | 100.0 /100 | #11 | Exceptional 6.9% |
| Assyrians/Chaldeans/Syriacs | 100.0 /100 | #12 | Exceptional 7.0% |
| Scandinavians | 100.0 /100 | #13 | Exceptional 7.0% |
| Mexicans | 100.0 /100 | #14 | Exceptional 7.0% |
| Whites/Caucasians | 100.0 /100 | #15 | Exceptional 7.0% |
| Europeans | 100.0 /100 | #16 | Exceptional 7.1% |
| Welsh | 100.0 /100 | #17 | Exceptional 7.2% |
| Tongans | 100.0 /100 | #18 | Exceptional 7.2% |
| Arapaho | 100.0 /100 | #19 | Exceptional 7.4% |
Demographics Similar to Immigrants from Uruguay by No Vehicles in Household
In terms of no vehicles in household, the demographic groups most similar to Immigrants from Uruguay are Honduran (12.0%, a difference of 0.27%), Egyptian (11.9%, a difference of 0.32%), Liberian (12.0%, a difference of 0.32%), Immigrants from Serbia (11.9%, a difference of 0.39%), and Black/African American (11.9%, a difference of 0.65%).
| Demographics | Rating | Rank | No Vehicles in Household |
| Immigrants | Czechoslovakia | 2.0 /100 | #247 | Tragic 11.8% |
| Immigrants | Belgium | 1.9 /100 | #248 | Tragic 11.8% |
| Immigrants | Nigeria | 1.9 /100 | #249 | Tragic 11.8% |
| Paiute | 1.8 /100 | #250 | Tragic 11.8% |
| Blacks/African Americans | 1.6 /100 | #251 | Tragic 11.9% |
| Immigrants | Serbia | 1.5 /100 | #252 | Tragic 11.9% |
| Egyptians | 1.4 /100 | #253 | Tragic 11.9% |
| Immigrants | Uruguay | 1.3 /100 | #254 | Tragic 11.9% |
| Hondurans | 1.2 /100 | #255 | Tragic 12.0% |
| Liberians | 1.2 /100 | #256 | Tragic 12.0% |
| Nigerians | 0.9 /100 | #257 | Tragic 12.1% |
| South American Indians | 0.9 /100 | #258 | Tragic 12.1% |
| Immigrants | Latvia | 0.8 /100 | #259 | Tragic 12.1% |
| Macedonians | 0.7 /100 | #260 | Tragic 12.2% |
| Sub-Saharan Africans | 0.6 /100 | #261 | Tragic 12.2% |