Kiowa vs Immigrants from Uruguay No Vehicles in Household
COMPARE
Kiowa
Immigrants from Uruguay
No Vehicles in Household
No Vehicles in Household Comparison
Kiowa
Immigrants from Uruguay
11.5%
NO VEHICLES IN HOUSEHOLD
4.0/ 100
METRIC RATING
235th/ 347
METRIC RANK
11.9%
NO VEHICLES IN HOUSEHOLD
1.3/ 100
METRIC RATING
254th/ 347
METRIC RANK
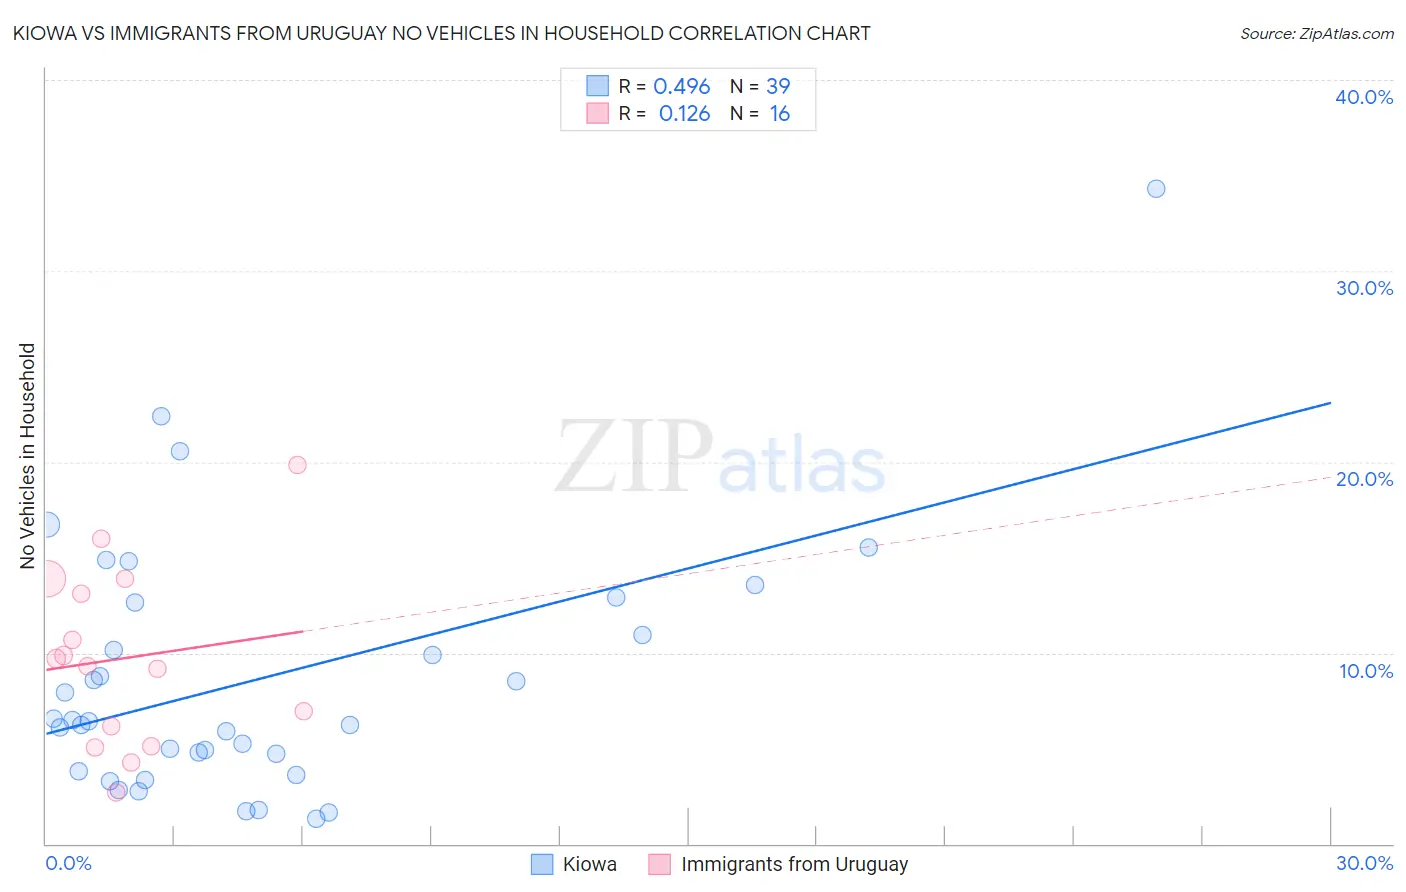
Kiowa vs Immigrants from Uruguay No Vehicles in Household Correlation Chart
The statistical analysis conducted on geographies consisting of 56,075,715 people shows a moderate positive correlation between the proportion of Kiowa and percentage of households with no vehicle available in the United States with a correlation coefficient (R) of 0.496 and weighted average of 11.5%. Similarly, the statistical analysis conducted on geographies consisting of 133,161,139 people shows a poor positive correlation between the proportion of Immigrants from Uruguay and percentage of households with no vehicle available in the United States with a correlation coefficient (R) of 0.126 and weighted average of 11.9%, a difference of 3.5%.
No Vehicles in Household Correlation Summary
| Measurement | Kiowa | Immigrants from Uruguay |
| Minimum | 1.3% | 2.7% |
| Maximum | 34.3% | 19.8% |
| Range | 33.0% | 17.2% |
| Mean | 8.7% | 9.7% |
| Median | 6.4% | 9.5% |
| Interquartile 25% (IQ1) | 3.8% | 5.6% |
| Interquartile 75% (IQ3) | 12.7% | 13.5% |
| Interquartile Range (IQR) | 8.8% | 7.9% |
| Standard Deviation (Sample) | 6.7% | 4.7% |
| Standard Deviation (Population) | 6.7% | 4.6% |
Demographics Similar to Kiowa and Immigrants from Uruguay by No Vehicles in Household
In terms of no vehicles in household, the demographic groups most similar to Kiowa are Cree (11.6%, a difference of 0.35%), Immigrants from Peru (11.5%, a difference of 0.38%), Ute (11.6%, a difference of 0.59%), Russian (11.6%, a difference of 0.64%), and Taiwanese (11.7%, a difference of 1.1%). Similarly, the demographic groups most similar to Immigrants from Uruguay are Egyptian (11.9%, a difference of 0.32%), Immigrants from Serbia (11.9%, a difference of 0.39%), Black/African American (11.9%, a difference of 0.65%), Paiute (11.8%, a difference of 1.0%), and Immigrants from Nigeria (11.8%, a difference of 1.2%).
| Demographics | Rating | Rank | No Vehicles in Household |
| Immigrants | Peru | 4.5 /100 | #234 | Tragic 11.5% |
| Kiowa | 4.0 /100 | #235 | Tragic 11.5% |
| Cree | 3.5 /100 | #236 | Tragic 11.6% |
| Ute | 3.3 /100 | #237 | Tragic 11.6% |
| Russians | 3.2 /100 | #238 | Tragic 11.6% |
| Taiwanese | 2.8 /100 | #239 | Tragic 11.7% |
| Immigrants | Immigrants | 2.7 /100 | #240 | Tragic 11.7% |
| Eastern Europeans | 2.7 /100 | #241 | Tragic 11.7% |
| Turks | 2.6 /100 | #242 | Tragic 11.7% |
| Cheyenne | 2.4 /100 | #243 | Tragic 11.7% |
| Immigrants | Portugal | 2.2 /100 | #244 | Tragic 11.7% |
| Immigrants | Honduras | 2.1 /100 | #245 | Tragic 11.8% |
| Menominee | 2.0 /100 | #246 | Tragic 11.8% |
| Immigrants | Czechoslovakia | 2.0 /100 | #247 | Tragic 11.8% |
| Immigrants | Belgium | 1.9 /100 | #248 | Tragic 11.8% |
| Immigrants | Nigeria | 1.9 /100 | #249 | Tragic 11.8% |
| Paiute | 1.8 /100 | #250 | Tragic 11.8% |
| Blacks/African Americans | 1.6 /100 | #251 | Tragic 11.9% |
| Immigrants | Serbia | 1.5 /100 | #252 | Tragic 11.9% |
| Egyptians | 1.4 /100 | #253 | Tragic 11.9% |
| Immigrants | Uruguay | 1.3 /100 | #254 | Tragic 11.9% |