Native/Alaskan vs Immigrants from Uruguay Self-Care Disability
COMPARE
Native/Alaskan
Immigrants from Uruguay
Self-Care Disability
Self-Care Disability Comparison
Natives/Alaskans
Immigrants from Uruguay
2.8%
SELF-CARE DISABILITY
0.0/ 100
METRIC RATING
307th/ 347
METRIC RANK
2.4%
SELF-CARE DISABILITY
85.4/ 100
METRIC RATING
140th/ 347
METRIC RANK
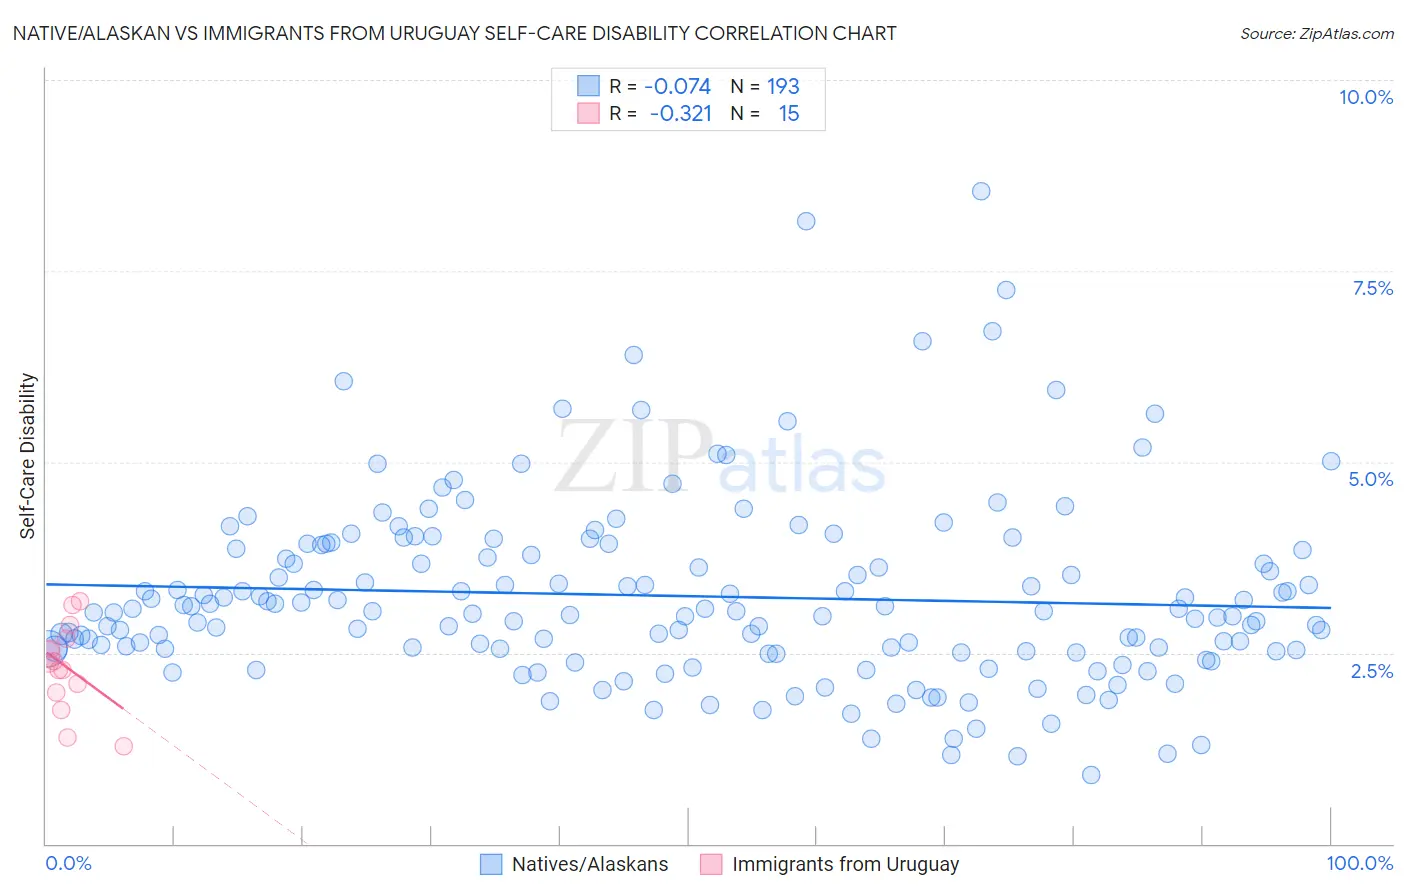
Native/Alaskan vs Immigrants from Uruguay Self-Care Disability Correlation Chart
The statistical analysis conducted on geographies consisting of 511,798,429 people shows a slight negative correlation between the proportion of Natives/Alaskans and percentage of population with self-care disability in the United States with a correlation coefficient (R) of -0.074 and weighted average of 2.8%. Similarly, the statistical analysis conducted on geographies consisting of 133,239,464 people shows a mild negative correlation between the proportion of Immigrants from Uruguay and percentage of population with self-care disability in the United States with a correlation coefficient (R) of -0.321 and weighted average of 2.4%, a difference of 16.2%.
Self-Care Disability Correlation Summary
| Measurement | Native/Alaskan | Immigrants from Uruguay |
| Minimum | 0.90% | 1.3% |
| Maximum | 8.5% | 3.2% |
| Range | 7.7% | 1.9% |
| Mean | 3.2% | 2.3% |
| Median | 3.0% | 2.4% |
| Interquartile 25% (IQ1) | 2.5% | 2.0% |
| Interquartile 75% (IQ3) | 3.9% | 2.7% |
| Interquartile Range (IQR) | 1.3% | 0.69% |
| Standard Deviation (Sample) | 1.2% | 0.56% |
| Standard Deviation (Population) | 1.2% | 0.54% |
Similar Demographics by Self-Care Disability
Demographics Similar to Natives/Alaskans by Self-Care Disability
In terms of self-care disability, the demographic groups most similar to Natives/Alaskans are Aleut (2.8%, a difference of 0.070%), Immigrants from Grenada (2.8%, a difference of 0.30%), Bangladeshi (2.8%, a difference of 0.45%), Immigrants from West Indies (2.8%, a difference of 0.47%), and Cree (2.8%, a difference of 0.52%).
| Demographics | Rating | Rank | Self-Care Disability |
| Immigrants | Fiji | 0.0 /100 | #300 | Tragic 2.8% |
| Pima | 0.0 /100 | #301 | Tragic 2.8% |
| Immigrants | St. Vincent and the Grenadines | 0.0 /100 | #302 | Tragic 2.8% |
| Immigrants | Belize | 0.0 /100 | #303 | Tragic 2.8% |
| Cree | 0.0 /100 | #304 | Tragic 2.8% |
| Immigrants | West Indies | 0.0 /100 | #305 | Tragic 2.8% |
| Aleuts | 0.0 /100 | #306 | Tragic 2.8% |
| Natives/Alaskans | 0.0 /100 | #307 | Tragic 2.8% |
| Immigrants | Grenada | 0.0 /100 | #308 | Tragic 2.8% |
| Bangladeshis | 0.0 /100 | #309 | Tragic 2.8% |
| British West Indians | 0.0 /100 | #310 | Tragic 2.8% |
| Puget Sound Salish | 0.0 /100 | #311 | Tragic 2.8% |
| Immigrants | Caribbean | 0.0 /100 | #312 | Tragic 2.8% |
| Spanish Americans | 0.0 /100 | #313 | Tragic 2.8% |
| Creek | 0.0 /100 | #314 | Tragic 2.8% |
Demographics Similar to Immigrants from Uruguay by Self-Care Disability
In terms of self-care disability, the demographic groups most similar to Immigrants from Uruguay are Alaska Native (2.4%, a difference of 0.090%), Immigrants from Croatia (2.4%, a difference of 0.12%), Sri Lankan (2.4%, a difference of 0.12%), Austrian (2.4%, a difference of 0.17%), and South American Indian (2.4%, a difference of 0.19%).
| Demographics | Rating | Rank | Self-Care Disability |
| Immigrants | Colombia | 88.5 /100 | #133 | Excellent 2.4% |
| Russians | 88.2 /100 | #134 | Excellent 2.4% |
| Laotians | 87.8 /100 | #135 | Excellent 2.4% |
| South American Indians | 87.2 /100 | #136 | Excellent 2.4% |
| Austrians | 87.0 /100 | #137 | Excellent 2.4% |
| Immigrants | Croatia | 86.6 /100 | #138 | Excellent 2.4% |
| Sri Lankans | 86.6 /100 | #139 | Excellent 2.4% |
| Immigrants | Uruguay | 85.4 /100 | #140 | Excellent 2.4% |
| Alaska Natives | 84.5 /100 | #141 | Excellent 2.4% |
| Immigrants | Peru | 83.2 /100 | #142 | Excellent 2.4% |
| Afghans | 82.3 /100 | #143 | Excellent 2.4% |
| Costa Ricans | 80.8 /100 | #144 | Excellent 2.4% |
| Germans | 80.1 /100 | #145 | Excellent 2.4% |
| Israelis | 80.0 /100 | #146 | Good 2.4% |
| Dutch | 77.5 /100 | #147 | Good 2.4% |