Native/Alaskan vs Immigrants from Uruguay In Labor Force | Age > 16
COMPARE
Native/Alaskan
Immigrants from Uruguay
In Labor Force | Age > 16
In Labor Force | Age > 16 Comparison
Natives/Alaskans
Immigrants from Uruguay
60.6%
IN LABOR FORCE | AGE > 16
0.0/ 100
METRIC RATING
335th/ 347
METRIC RANK
66.0%
IN LABOR FORCE | AGE > 16
99.1/ 100
METRIC RATING
95th/ 347
METRIC RANK
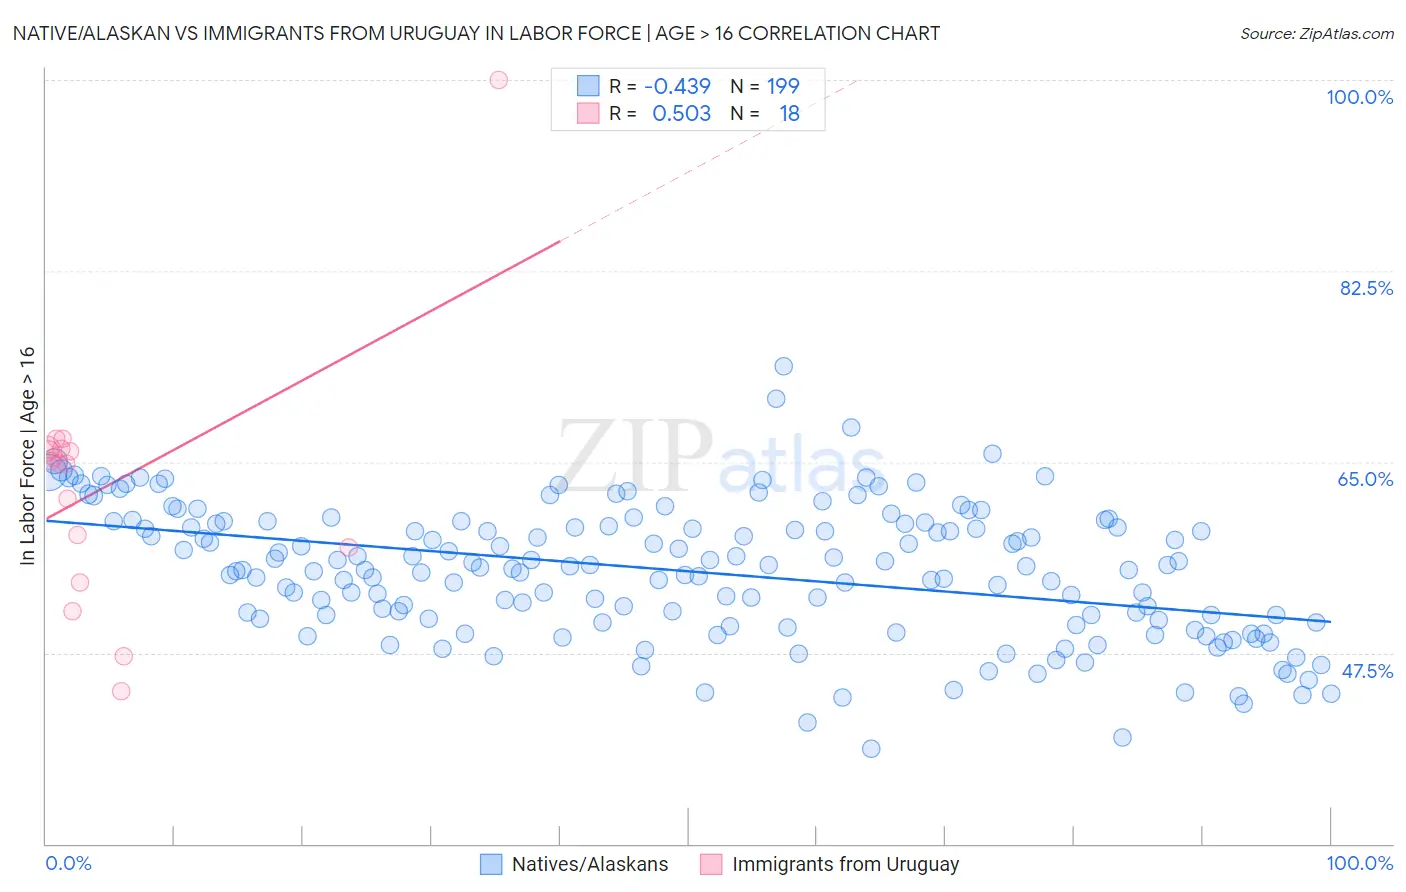
Native/Alaskan vs Immigrants from Uruguay In Labor Force | Age > 16 Correlation Chart
The statistical analysis conducted on geographies consisting of 513,032,279 people shows a moderate negative correlation between the proportion of Natives/Alaskans and labor force participation rate among population ages 16 and over in the United States with a correlation coefficient (R) of -0.439 and weighted average of 60.6%. Similarly, the statistical analysis conducted on geographies consisting of 133,256,636 people shows a substantial positive correlation between the proportion of Immigrants from Uruguay and labor force participation rate among population ages 16 and over in the United States with a correlation coefficient (R) of 0.503 and weighted average of 66.0%, a difference of 8.9%.
In Labor Force | Age > 16 Correlation Summary
| Measurement | Native/Alaskan | Immigrants from Uruguay |
| Minimum | 38.7% | 44.0% |
| Maximum | 73.8% | 100.0% |
| Range | 35.1% | 56.0% |
| Mean | 55.0% | 62.9% |
| Median | 55.3% | 64.9% |
| Interquartile 25% (IQ1) | 50.5% | 57.1% |
| Interquartile 75% (IQ3) | 59.3% | 66.2% |
| Interquartile Range (IQR) | 8.9% | 9.1% |
| Standard Deviation (Sample) | 6.1% | 11.7% |
| Standard Deviation (Population) | 6.1% | 11.4% |
Similar Demographics by In Labor Force | Age > 16
Demographics Similar to Natives/Alaskans by In Labor Force | Age > 16
In terms of in labor force | age > 16, the demographic groups most similar to Natives/Alaskans are Menominee (60.6%, a difference of 0.020%), Apache (60.7%, a difference of 0.19%), Paiute (60.7%, a difference of 0.23%), Crow (60.8%, a difference of 0.31%), and Ute (60.9%, a difference of 0.49%).
| Demographics | Rating | Rank | In Labor Force | Age > 16 |
| Dutch West Indians | 0.0 /100 | #328 | Tragic 61.7% |
| Choctaw | 0.0 /100 | #329 | Tragic 61.5% |
| Creek | 0.0 /100 | #330 | Tragic 61.3% |
| Ute | 0.0 /100 | #331 | Tragic 60.9% |
| Crow | 0.0 /100 | #332 | Tragic 60.8% |
| Paiute | 0.0 /100 | #333 | Tragic 60.7% |
| Apache | 0.0 /100 | #334 | Tragic 60.7% |
| Natives/Alaskans | 0.0 /100 | #335 | Tragic 60.6% |
| Menominee | 0.0 /100 | #336 | Tragic 60.6% |
| Colville | 0.0 /100 | #337 | Tragic 59.8% |
| Immigrants | Yemen | 0.0 /100 | #338 | Tragic 59.6% |
| Houma | 0.0 /100 | #339 | Tragic 59.5% |
| Pueblo | 0.0 /100 | #340 | Tragic 59.3% |
| Hopi | 0.0 /100 | #341 | Tragic 58.4% |
| Puerto Ricans | 0.0 /100 | #342 | Tragic 58.1% |
Demographics Similar to Immigrants from Uruguay by In Labor Force | Age > 16
In terms of in labor force | age > 16, the demographic groups most similar to Immigrants from Uruguay are Immigrants from Cambodia (66.0%, a difference of 0.0%), Aleut (66.0%, a difference of 0.020%), Immigrants from South America (66.0%, a difference of 0.020%), Bangladeshi (65.9%, a difference of 0.040%), and Immigrants from Laos (66.0%, a difference of 0.050%).
| Demographics | Rating | Rank | In Labor Force | Age > 16 |
| Bermudans | 99.3 /100 | #88 | Exceptional 66.0% |
| Immigrants | Laos | 99.2 /100 | #89 | Exceptional 66.0% |
| Chileans | 99.2 /100 | #90 | Exceptional 66.0% |
| Iranians | 99.2 /100 | #91 | Exceptional 66.0% |
| Aleuts | 99.1 /100 | #92 | Exceptional 66.0% |
| Immigrants | South America | 99.1 /100 | #93 | Exceptional 66.0% |
| Immigrants | Cambodia | 99.1 /100 | #94 | Exceptional 66.0% |
| Immigrants | Uruguay | 99.1 /100 | #95 | Exceptional 66.0% |
| Bangladeshis | 98.9 /100 | #96 | Exceptional 65.9% |
| Filipinos | 98.9 /100 | #97 | Exceptional 65.9% |
| Immigrants | Chile | 98.7 /100 | #98 | Exceptional 65.9% |
| Immigrants | Australia | 98.7 /100 | #99 | Exceptional 65.9% |
| Okinawans | 98.7 /100 | #100 | Exceptional 65.9% |
| Immigrants | Colombia | 98.6 /100 | #101 | Exceptional 65.9% |
| Uruguayans | 98.6 /100 | #102 | Exceptional 65.9% |