Turkish vs Immigrants from Uruguay No Vehicles in Household
COMPARE
Turkish
Immigrants from Uruguay
No Vehicles in Household
No Vehicles in Household Comparison
Turks
Immigrants from Uruguay
11.7%
NO VEHICLES IN HOUSEHOLD
2.6/ 100
METRIC RATING
242nd/ 347
METRIC RANK
11.9%
NO VEHICLES IN HOUSEHOLD
1.3/ 100
METRIC RATING
254th/ 347
METRIC RANK
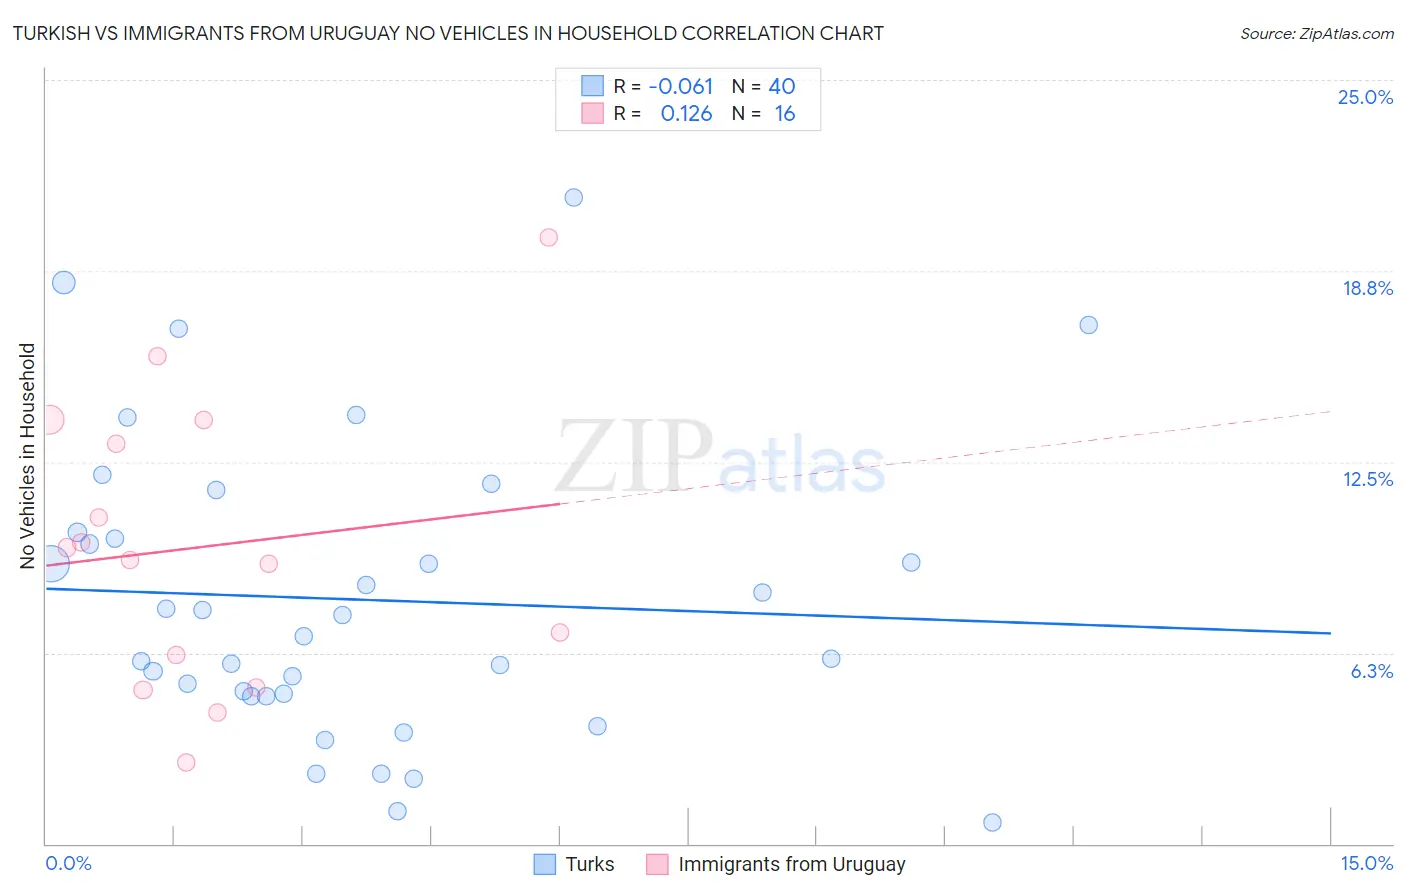
Turkish vs Immigrants from Uruguay No Vehicles in Household Correlation Chart
The statistical analysis conducted on geographies consisting of 271,510,878 people shows a slight negative correlation between the proportion of Turks and percentage of households with no vehicle available in the United States with a correlation coefficient (R) of -0.061 and weighted average of 11.7%. Similarly, the statistical analysis conducted on geographies consisting of 133,161,139 people shows a poor positive correlation between the proportion of Immigrants from Uruguay and percentage of households with no vehicle available in the United States with a correlation coefficient (R) of 0.126 and weighted average of 11.9%, a difference of 2.2%.
No Vehicles in Household Correlation Summary
| Measurement | Turkish | Immigrants from Uruguay |
| Minimum | 0.69% | 2.7% |
| Maximum | 21.1% | 19.8% |
| Range | 20.4% | 17.2% |
| Mean | 8.0% | 9.7% |
| Median | 7.1% | 9.5% |
| Interquartile 25% (IQ1) | 4.9% | 5.6% |
| Interquartile 75% (IQ3) | 10.1% | 13.5% |
| Interquartile Range (IQR) | 5.2% | 7.9% |
| Standard Deviation (Sample) | 4.8% | 4.7% |
| Standard Deviation (Population) | 4.8% | 4.6% |
Demographics Similar to Turks and Immigrants from Uruguay by No Vehicles in Household
In terms of no vehicles in household, the demographic groups most similar to Turks are Eastern European (11.7%, a difference of 0.11%), Immigrants (11.7%, a difference of 0.12%), Taiwanese (11.7%, a difference of 0.18%), Cheyenne (11.7%, a difference of 0.33%), and Immigrants from Portugal (11.7%, a difference of 0.51%). Similarly, the demographic groups most similar to Immigrants from Uruguay are Honduran (12.0%, a difference of 0.27%), Egyptian (11.9%, a difference of 0.32%), Liberian (12.0%, a difference of 0.32%), Immigrants from Serbia (11.9%, a difference of 0.39%), and Black/African American (11.9%, a difference of 0.65%).
| Demographics | Rating | Rank | No Vehicles in Household |
| Russians | 3.2 /100 | #238 | Tragic 11.6% |
| Taiwanese | 2.8 /100 | #239 | Tragic 11.7% |
| Immigrants | Immigrants | 2.7 /100 | #240 | Tragic 11.7% |
| Eastern Europeans | 2.7 /100 | #241 | Tragic 11.7% |
| Turks | 2.6 /100 | #242 | Tragic 11.7% |
| Cheyenne | 2.4 /100 | #243 | Tragic 11.7% |
| Immigrants | Portugal | 2.2 /100 | #244 | Tragic 11.7% |
| Immigrants | Honduras | 2.1 /100 | #245 | Tragic 11.8% |
| Menominee | 2.0 /100 | #246 | Tragic 11.8% |
| Immigrants | Czechoslovakia | 2.0 /100 | #247 | Tragic 11.8% |
| Immigrants | Belgium | 1.9 /100 | #248 | Tragic 11.8% |
| Immigrants | Nigeria | 1.9 /100 | #249 | Tragic 11.8% |
| Paiute | 1.8 /100 | #250 | Tragic 11.8% |
| Blacks/African Americans | 1.6 /100 | #251 | Tragic 11.9% |
| Immigrants | Serbia | 1.5 /100 | #252 | Tragic 11.9% |
| Egyptians | 1.4 /100 | #253 | Tragic 11.9% |
| Immigrants | Uruguay | 1.3 /100 | #254 | Tragic 11.9% |
| Hondurans | 1.2 /100 | #255 | Tragic 12.0% |
| Liberians | 1.2 /100 | #256 | Tragic 12.0% |
| Nigerians | 0.9 /100 | #257 | Tragic 12.1% |
| South American Indians | 0.9 /100 | #258 | Tragic 12.1% |