Mongolian vs Immigrants from Laos 3 or more Vehicles in Household
COMPARE
Mongolian
Immigrants from Laos
3 or more Vehicles in Household
3 or more Vehicles in Household Comparison
Mongolians
Immigrants from Laos
18.1%
3 OR MORE VEHICLES IN HOUSEHOLD
2.3/ 100
METRIC RATING
244th/ 347
METRIC RANK
22.4%
3 OR MORE VEHICLES IN HOUSEHOLD
100.0/ 100
METRIC RATING
55th/ 347
METRIC RANK
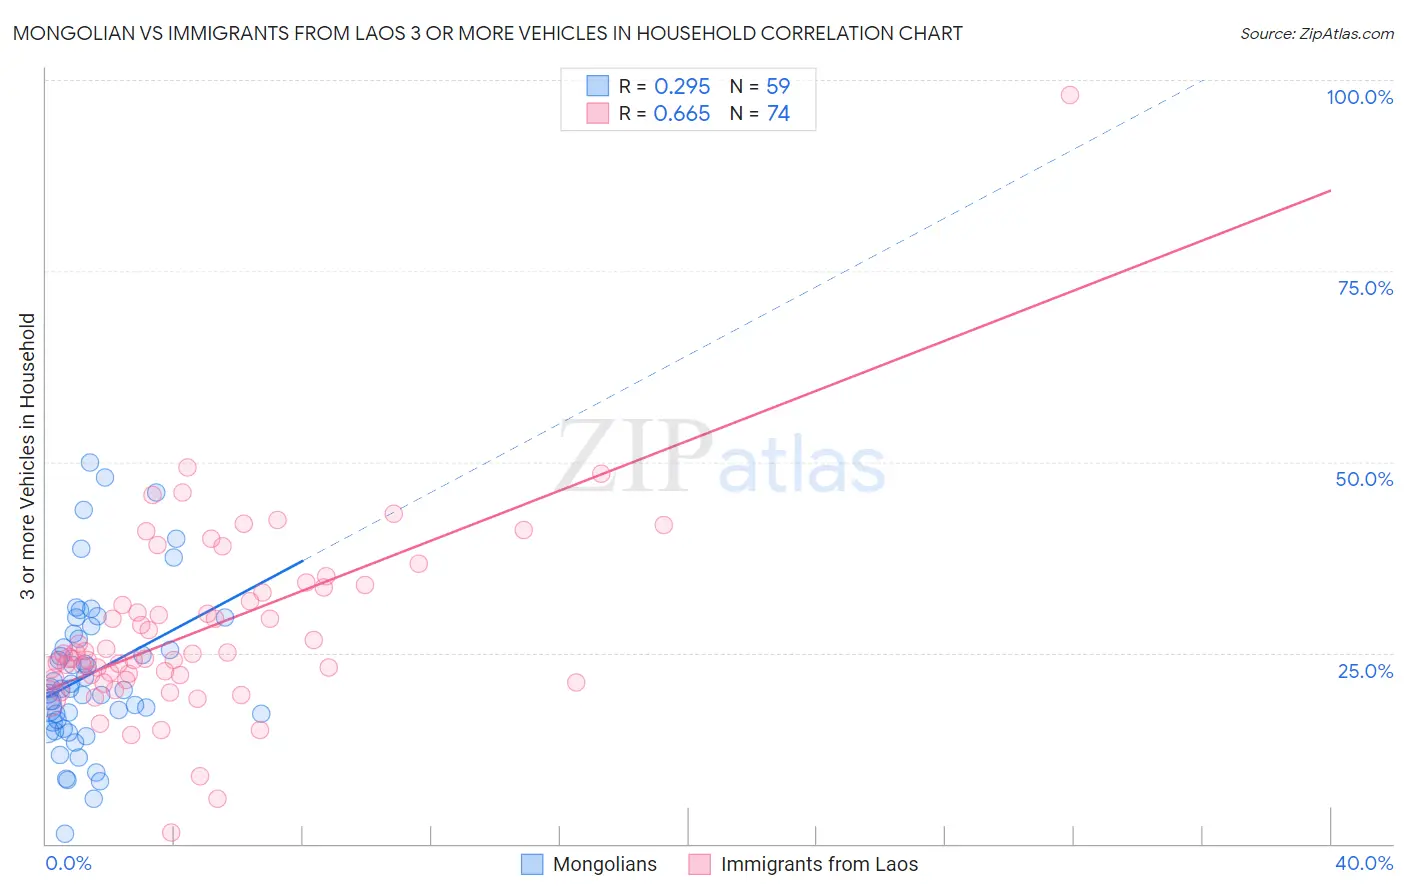
Mongolian vs Immigrants from Laos 3 or more Vehicles in Household Correlation Chart
The statistical analysis conducted on geographies consisting of 140,244,475 people shows a weak positive correlation between the proportion of Mongolians and percentage of households with 3 or more vehicles available in the United States with a correlation coefficient (R) of 0.295 and weighted average of 18.1%. Similarly, the statistical analysis conducted on geographies consisting of 201,457,324 people shows a significant positive correlation between the proportion of Immigrants from Laos and percentage of households with 3 or more vehicles available in the United States with a correlation coefficient (R) of 0.665 and weighted average of 22.4%, a difference of 23.6%.
3 or more Vehicles in Household Correlation Summary
| Measurement | Mongolian | Immigrants from Laos |
| Minimum | 1.4% | 1.5% |
| Maximum | 50.0% | 98.0% |
| Range | 48.6% | 96.4% |
| Mean | 22.2% | 28.1% |
| Median | 20.2% | 24.8% |
| Interquartile 25% (IQ1) | 15.9% | 22.0% |
| Interquartile 75% (IQ3) | 27.4% | 33.5% |
| Interquartile Range (IQR) | 11.5% | 11.5% |
| Standard Deviation (Sample) | 10.3% | 12.6% |
| Standard Deviation (Population) | 10.2% | 12.5% |
Similar Demographics by 3 or more Vehicles in Household
Demographics Similar to Mongolians by 3 or more Vehicles in Household
In terms of 3 or more vehicles in household, the demographic groups most similar to Mongolians are Immigrants from Europe (18.1%, a difference of 0.12%), Immigrants from Belize (18.1%, a difference of 0.16%), Immigrants from Australia (18.1%, a difference of 0.23%), Hopi (18.2%, a difference of 0.24%), and African (18.2%, a difference of 0.35%).
| Demographics | Rating | Rank | 3 or more Vehicles in Household |
| Indonesians | 3.5 /100 | #237 | Tragic 18.3% |
| Immigrants | Honduras | 3.1 /100 | #238 | Tragic 18.2% |
| Immigrants | Middle Africa | 3.1 /100 | #239 | Tragic 18.2% |
| Immigrants | China | 2.9 /100 | #240 | Tragic 18.2% |
| Africans | 2.7 /100 | #241 | Tragic 18.2% |
| Hopi | 2.5 /100 | #242 | Tragic 18.2% |
| Immigrants | Europe | 2.4 /100 | #243 | Tragic 18.1% |
| Mongolians | 2.3 /100 | #244 | Tragic 18.1% |
| Immigrants | Belize | 2.1 /100 | #245 | Tragic 18.1% |
| Immigrants | Australia | 2.0 /100 | #246 | Tragic 18.1% |
| Carpatho Rusyns | 1.9 /100 | #247 | Tragic 18.0% |
| Immigrants | Eastern Africa | 1.8 /100 | #248 | Tragic 18.0% |
| Immigrants | Saudi Arabia | 1.7 /100 | #249 | Tragic 18.0% |
| Venezuelans | 1.7 /100 | #250 | Tragic 18.0% |
| Alsatians | 1.5 /100 | #251 | Tragic 18.0% |
Demographics Similar to Immigrants from Laos by 3 or more Vehicles in Household
In terms of 3 or more vehicles in household, the demographic groups most similar to Immigrants from Laos are Hispanic or Latino (22.4%, a difference of 0.030%), Pennsylvania German (22.3%, a difference of 0.18%), Spaniard (22.3%, a difference of 0.32%), Crow (22.5%, a difference of 0.37%), and Navajo (22.3%, a difference of 0.38%).
| Demographics | Rating | Rank | 3 or more Vehicles in Household |
| Scottish | 100.0 /100 | #48 | Exceptional 22.6% |
| Scotch-Irish | 100.0 /100 | #49 | Exceptional 22.6% |
| Sioux | 100.0 /100 | #50 | Exceptional 22.6% |
| Whites/Caucasians | 100.0 /100 | #51 | Exceptional 22.6% |
| Welsh | 100.0 /100 | #52 | Exceptional 22.6% |
| Czechs | 100.0 /100 | #53 | Exceptional 22.5% |
| Crow | 100.0 /100 | #54 | Exceptional 22.5% |
| Immigrants | Laos | 100.0 /100 | #55 | Exceptional 22.4% |
| Hispanics or Latinos | 100.0 /100 | #56 | Exceptional 22.4% |
| Pennsylvania Germans | 100.0 /100 | #57 | Exceptional 22.3% |
| Spaniards | 100.0 /100 | #58 | Exceptional 22.3% |
| Navajo | 100.0 /100 | #59 | Exceptional 22.3% |
| Finns | 99.9 /100 | #60 | Exceptional 22.3% |
| Bhutanese | 99.9 /100 | #61 | Exceptional 22.2% |
| Fijians | 99.9 /100 | #62 | Exceptional 22.2% |