Mongolian vs Senegalese 3 or more Vehicles in Household
COMPARE
Mongolian
Senegalese
3 or more Vehicles in Household
3 or more Vehicles in Household Comparison
Mongolians
Senegalese
18.1%
3 OR MORE VEHICLES IN HOUSEHOLD
2.3/ 100
METRIC RATING
244th/ 347
METRIC RANK
14.2%
3 OR MORE VEHICLES IN HOUSEHOLD
0.0/ 100
METRIC RATING
325th/ 347
METRIC RANK
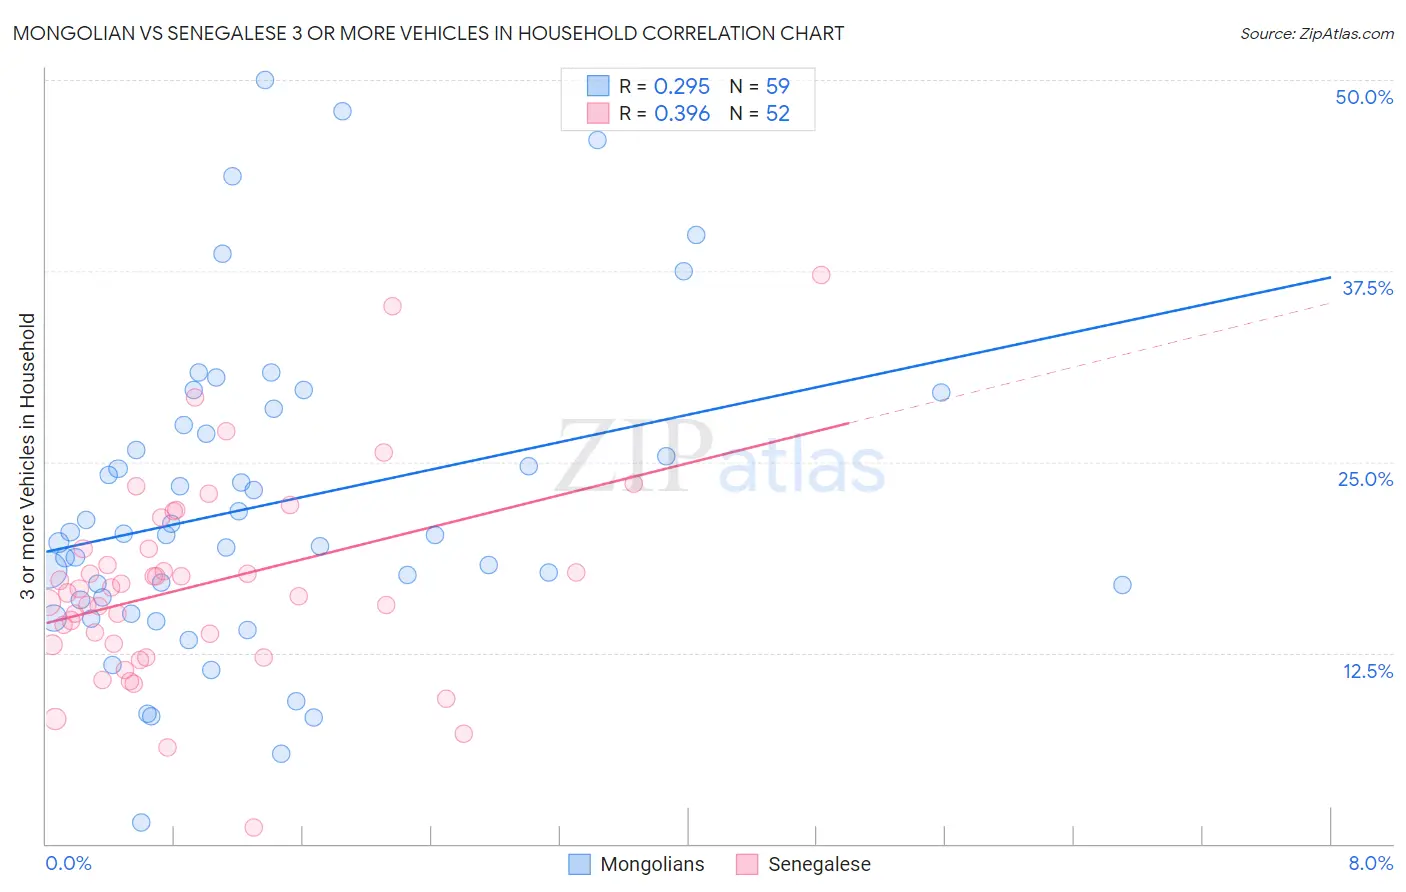
Mongolian vs Senegalese 3 or more Vehicles in Household Correlation Chart
The statistical analysis conducted on geographies consisting of 140,244,475 people shows a weak positive correlation between the proportion of Mongolians and percentage of households with 3 or more vehicles available in the United States with a correlation coefficient (R) of 0.295 and weighted average of 18.1%. Similarly, the statistical analysis conducted on geographies consisting of 78,101,014 people shows a mild positive correlation between the proportion of Senegalese and percentage of households with 3 or more vehicles available in the United States with a correlation coefficient (R) of 0.396 and weighted average of 14.2%, a difference of 27.3%.
3 or more Vehicles in Household Correlation Summary
| Measurement | Mongolian | Senegalese |
| Minimum | 1.4% | 1.1% |
| Maximum | 50.0% | 37.3% |
| Range | 48.6% | 36.2% |
| Mean | 22.2% | 16.9% |
| Median | 20.2% | 16.6% |
| Interquartile 25% (IQ1) | 15.9% | 13.1% |
| Interquartile 75% (IQ3) | 27.4% | 19.3% |
| Interquartile Range (IQR) | 11.5% | 6.3% |
| Standard Deviation (Sample) | 10.3% | 6.6% |
| Standard Deviation (Population) | 10.2% | 6.5% |
Similar Demographics by 3 or more Vehicles in Household
Demographics Similar to Mongolians by 3 or more Vehicles in Household
In terms of 3 or more vehicles in household, the demographic groups most similar to Mongolians are Immigrants from Europe (18.1%, a difference of 0.12%), Immigrants from Belize (18.1%, a difference of 0.16%), Immigrants from Australia (18.1%, a difference of 0.23%), Hopi (18.2%, a difference of 0.24%), and African (18.2%, a difference of 0.35%).
| Demographics | Rating | Rank | 3 or more Vehicles in Household |
| Indonesians | 3.5 /100 | #237 | Tragic 18.3% |
| Immigrants | Honduras | 3.1 /100 | #238 | Tragic 18.2% |
| Immigrants | Middle Africa | 3.1 /100 | #239 | Tragic 18.2% |
| Immigrants | China | 2.9 /100 | #240 | Tragic 18.2% |
| Africans | 2.7 /100 | #241 | Tragic 18.2% |
| Hopi | 2.5 /100 | #242 | Tragic 18.2% |
| Immigrants | Europe | 2.4 /100 | #243 | Tragic 18.1% |
| Mongolians | 2.3 /100 | #244 | Tragic 18.1% |
| Immigrants | Belize | 2.1 /100 | #245 | Tragic 18.1% |
| Immigrants | Australia | 2.0 /100 | #246 | Tragic 18.1% |
| Carpatho Rusyns | 1.9 /100 | #247 | Tragic 18.0% |
| Immigrants | Eastern Africa | 1.8 /100 | #248 | Tragic 18.0% |
| Immigrants | Saudi Arabia | 1.7 /100 | #249 | Tragic 18.0% |
| Venezuelans | 1.7 /100 | #250 | Tragic 18.0% |
| Alsatians | 1.5 /100 | #251 | Tragic 18.0% |
Demographics Similar to Senegalese by 3 or more Vehicles in Household
In terms of 3 or more vehicles in household, the demographic groups most similar to Senegalese are Immigrants from Yemen (14.2%, a difference of 0.080%), Soviet Union (14.2%, a difference of 0.33%), Ecuadorian (14.1%, a difference of 1.2%), Immigrants from Albania (14.0%, a difference of 1.9%), and Immigrants from Caribbean (14.6%, a difference of 2.4%).
| Demographics | Rating | Rank | 3 or more Vehicles in Household |
| Immigrants | Haiti | 0.0 /100 | #318 | Tragic 15.2% |
| Cape Verdeans | 0.0 /100 | #319 | Tragic 15.0% |
| Yup'ik | 0.0 /100 | #320 | Tragic 14.8% |
| Immigrants | Jamaica | 0.0 /100 | #321 | Tragic 14.7% |
| Immigrants | West Indies | 0.0 /100 | #322 | Tragic 14.6% |
| Immigrants | Caribbean | 0.0 /100 | #323 | Tragic 14.6% |
| Immigrants | Yemen | 0.0 /100 | #324 | Tragic 14.2% |
| Senegalese | 0.0 /100 | #325 | Tragic 14.2% |
| Soviet Union | 0.0 /100 | #326 | Tragic 14.2% |
| Ecuadorians | 0.0 /100 | #327 | Tragic 14.1% |
| Immigrants | Albania | 0.0 /100 | #328 | Tragic 14.0% |
| Immigrants | Senegal | 0.0 /100 | #329 | Tragic 13.8% |
| West Indians | 0.0 /100 | #330 | Tragic 13.7% |
| Immigrants | Dominica | 0.0 /100 | #331 | Tragic 13.7% |
| Trinidadians and Tobagonians | 0.0 /100 | #332 | Tragic 13.6% |