Immigrants from Denmark vs Colombian 2 or more Vehicles in Household
COMPARE
Immigrants from Denmark
Colombian
2 or more Vehicles in Household
2 or more Vehicles in Household Comparison
Immigrants from Denmark
Colombians
55.3%
2 OR MORE VEHICLES IN HOUSEHOLD
49.4/ 100
METRIC RATING
175th/ 347
METRIC RANK
52.9%
2 OR MORE VEHICLES IN HOUSEHOLD
1.1/ 100
METRIC RATING
248th/ 347
METRIC RANK
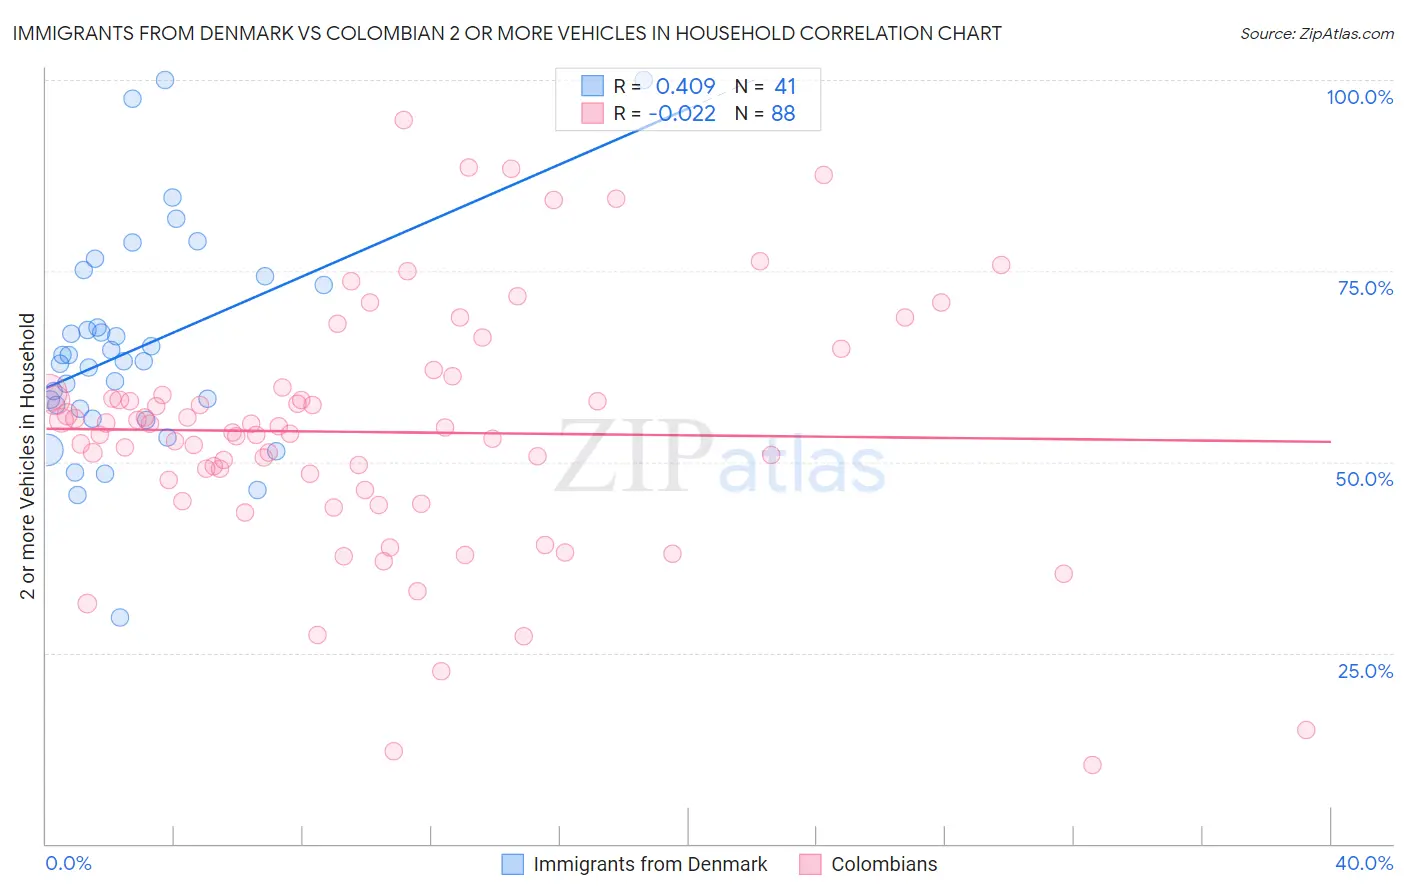
Immigrants from Denmark vs Colombian 2 or more Vehicles in Household Correlation Chart
The statistical analysis conducted on geographies consisting of 136,403,254 people shows a moderate positive correlation between the proportion of Immigrants from Denmark and percentage of households with 2 or more vehicles available in the United States with a correlation coefficient (R) of 0.409 and weighted average of 55.3%. Similarly, the statistical analysis conducted on geographies consisting of 419,364,720 people shows no correlation between the proportion of Colombians and percentage of households with 2 or more vehicles available in the United States with a correlation coefficient (R) of -0.022 and weighted average of 52.9%, a difference of 4.7%.
2 or more Vehicles in Household Correlation Summary
| Measurement | Immigrants from Denmark | Colombian |
| Minimum | 29.6% | 10.3% |
| Maximum | 100.0% | 94.8% |
| Range | 70.4% | 84.5% |
| Mean | 64.9% | 53.9% |
| Median | 63.2% | 54.2% |
| Interquartile 25% (IQ1) | 56.3% | 46.9% |
| Interquartile 75% (IQ3) | 73.8% | 58.9% |
| Interquartile Range (IQR) | 17.5% | 12.0% |
| Standard Deviation (Sample) | 14.6% | 16.1% |
| Standard Deviation (Population) | 14.4% | 16.0% |
Similar Demographics by 2 or more Vehicles in Household
Demographics Similar to Immigrants from Denmark by 2 or more Vehicles in Household
In terms of 2 or more vehicles in household, the demographic groups most similar to Immigrants from Denmark are Navajo (55.3%, a difference of 0.020%), Immigrants from Western Europe (55.4%, a difference of 0.080%), Immigrants from Nicaragua (55.4%, a difference of 0.090%), Immigrants from Cuba (55.3%, a difference of 0.090%), and Menominee (55.3%, a difference of 0.13%).
| Demographics | Rating | Rank | 2 or more Vehicles in Household |
| French American Indians | 56.7 /100 | #168 | Average 55.5% |
| Immigrants | Austria | 56.3 /100 | #169 | Average 55.5% |
| Romanians | 55.8 /100 | #170 | Average 55.5% |
| Immigrants | Costa Rica | 54.4 /100 | #171 | Average 55.4% |
| Immigrants | Nicaragua | 51.6 /100 | #172 | Average 55.4% |
| Immigrants | Western Europe | 51.4 /100 | #173 | Average 55.4% |
| Navajo | 50.0 /100 | #174 | Average 55.3% |
| Immigrants | Denmark | 49.4 /100 | #175 | Average 55.3% |
| Immigrants | Cuba | 47.0 /100 | #176 | Average 55.3% |
| Menominee | 46.2 /100 | #177 | Average 55.3% |
| Immigrants | Sweden | 45.3 /100 | #178 | Average 55.2% |
| Alaskan Athabascans | 42.9 /100 | #179 | Average 55.2% |
| Immigrants | Kenya | 40.4 /100 | #180 | Average 55.1% |
| Immigrants | Micronesia | 38.2 /100 | #181 | Fair 55.1% |
| Cree | 38.2 /100 | #182 | Fair 55.1% |
Demographics Similar to Colombians by 2 or more Vehicles in Household
In terms of 2 or more vehicles in household, the demographic groups most similar to Colombians are Immigrants from Brazil (52.8%, a difference of 0.060%), Mongolian (52.8%, a difference of 0.060%), Immigrants from Sudan (52.8%, a difference of 0.090%), Immigrants from Portugal (52.8%, a difference of 0.10%), and Sierra Leonean (52.9%, a difference of 0.12%).
| Demographics | Rating | Rank | 2 or more Vehicles in Household |
| Immigrants | Sierra Leone | 2.1 /100 | #241 | Tragic 53.2% |
| Immigrants | Eastern Asia | 2.1 /100 | #242 | Tragic 53.2% |
| Ethiopians | 1.7 /100 | #243 | Tragic 53.1% |
| Indians (Asian) | 1.7 /100 | #244 | Tragic 53.1% |
| Immigrants | Ethiopia | 1.5 /100 | #245 | Tragic 53.0% |
| Immigrants | Nigeria | 1.2 /100 | #246 | Tragic 52.9% |
| Sierra Leoneans | 1.2 /100 | #247 | Tragic 52.9% |
| Colombians | 1.1 /100 | #248 | Tragic 52.9% |
| Immigrants | Brazil | 1.0 /100 | #249 | Tragic 52.8% |
| Mongolians | 1.0 /100 | #250 | Tragic 52.8% |
| Immigrants | Sudan | 1.0 /100 | #251 | Tragic 52.8% |
| Immigrants | Portugal | 1.0 /100 | #252 | Tragic 52.8% |
| Nigerians | 0.9 /100 | #253 | Tragic 52.8% |
| Immigrants | Malaysia | 0.8 /100 | #254 | Tragic 52.7% |
| Uruguayans | 0.7 /100 | #255 | Tragic 52.7% |