Lumbee vs Colombian Householder Income Under 25 years
COMPARE
Lumbee
Colombian
Householder Income Under 25 years
Householder Income Under 25 years Comparison
Lumbee
Colombians
$34,584
HOUSEHOLDER INCOME UNDER 25 YEARS
0.0/ 100
METRIC RATING
347th/ 347
METRIC RANK
$53,357
HOUSEHOLDER INCOME UNDER 25 YEARS
94.6/ 100
METRIC RATING
124th/ 347
METRIC RANK
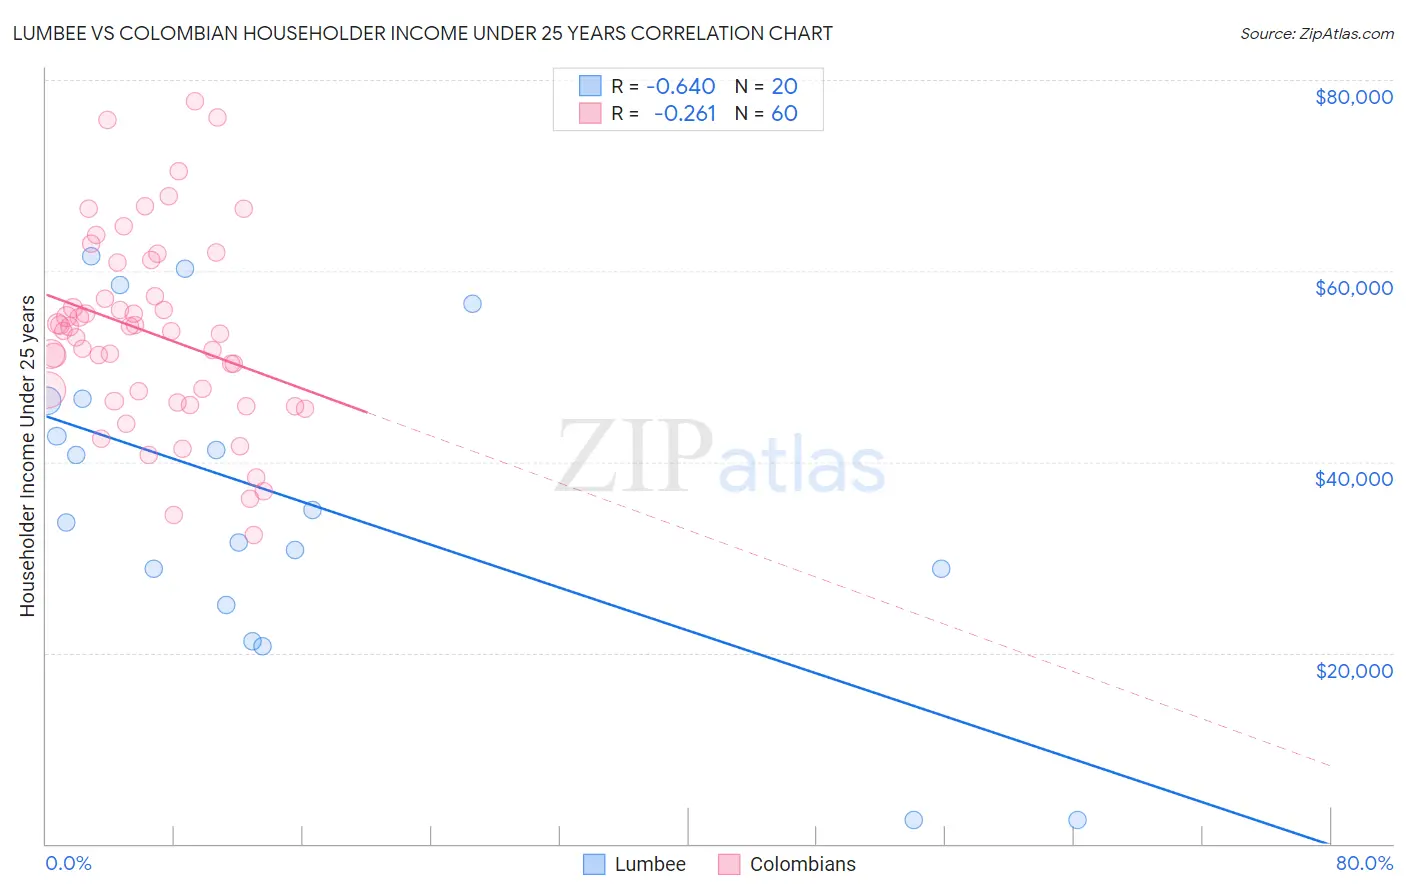
Lumbee vs Colombian Householder Income Under 25 years Correlation Chart
The statistical analysis conducted on geographies consisting of 86,473,772 people shows a significant negative correlation between the proportion of Lumbee and household income with householder under the age of 25 in the United States with a correlation coefficient (R) of -0.640 and weighted average of $34,584. Similarly, the statistical analysis conducted on geographies consisting of 350,831,291 people shows a weak negative correlation between the proportion of Colombians and household income with householder under the age of 25 in the United States with a correlation coefficient (R) of -0.261 and weighted average of $53,357, a difference of 54.3%.
Householder Income Under 25 years Correlation Summary
| Measurement | Lumbee | Colombian |
| Minimum | $2,499 | $32,315 |
| Maximum | $61,485 | $77,798 |
| Range | $58,986 | $45,483 |
| Mean | $35,754 | $53,495 |
| Median | $34,331 | $53,679 |
| Interquartile 25% (IQ1) | $26,875 | $46,265 |
| Interquartile 75% (IQ3) | $46,497 | $59,118 |
| Interquartile Range (IQR) | $19,622 | $12,853 |
| Standard Deviation (Sample) | $16,953 | $10,089 |
| Standard Deviation (Population) | $16,524 | $10,004 |
Similar Demographics by Householder Income Under 25 years
Demographics Similar to Lumbee by Householder Income Under 25 years
In terms of householder income under 25 years, the demographic groups most similar to Lumbee are Puerto Rican ($39,726, a difference of 14.9%), Navajo ($42,380, a difference of 22.5%), Immigrants from Congo ($43,266, a difference of 25.1%), Immigrants from Yemen ($43,591, a difference of 26.0%), and Arapaho ($44,003, a difference of 27.2%).
| Demographics | Rating | Rank | Householder Income Under 25 years |
| Creek | 0.0 /100 | #333 | Tragic $45,371 |
| Cajuns | 0.0 /100 | #334 | Tragic $45,338 |
| Cheyenne | 0.0 /100 | #335 | Tragic $45,275 |
| Tohono O'odham | 0.0 /100 | #336 | Tragic $45,248 |
| Pueblo | 0.0 /100 | #337 | Tragic $45,018 |
| Chickasaw | 0.0 /100 | #338 | Tragic $44,763 |
| Kiowa | 0.0 /100 | #339 | Tragic $44,733 |
| Blacks/African Americans | 0.0 /100 | #340 | Tragic $44,381 |
| Houma | 0.0 /100 | #341 | Tragic $44,356 |
| Arapaho | 0.0 /100 | #342 | Tragic $44,003 |
| Immigrants | Yemen | 0.0 /100 | #343 | Tragic $43,591 |
| Immigrants | Congo | 0.0 /100 | #344 | Tragic $43,266 |
| Navajo | 0.0 /100 | #345 | Tragic $42,380 |
| Puerto Ricans | 0.0 /100 | #346 | Tragic $39,726 |
| Lumbee | 0.0 /100 | #347 | Tragic $34,584 |
Demographics Similar to Colombians by Householder Income Under 25 years
In terms of householder income under 25 years, the demographic groups most similar to Colombians are Immigrants from Iraq ($53,384, a difference of 0.050%), Pakistani ($53,325, a difference of 0.060%), Immigrants from Serbia ($53,321, a difference of 0.070%), Immigrants from North America ($53,307, a difference of 0.090%), and Immigrants from Canada ($53,411, a difference of 0.10%).
| Demographics | Rating | Rank | Householder Income Under 25 years |
| Lithuanians | 96.6 /100 | #117 | Exceptional $53,552 |
| Immigrants | Switzerland | 96.3 /100 | #118 | Exceptional $53,528 |
| Italians | 95.4 /100 | #119 | Exceptional $53,426 |
| Guamanians/Chamorros | 95.3 /100 | #120 | Exceptional $53,423 |
| Immigrants | Canada | 95.2 /100 | #121 | Exceptional $53,411 |
| Immigrants | Ethiopia | 95.2 /100 | #122 | Exceptional $53,408 |
| Immigrants | Iraq | 94.9 /100 | #123 | Exceptional $53,384 |
| Colombians | 94.6 /100 | #124 | Exceptional $53,357 |
| Pakistanis | 94.1 /100 | #125 | Exceptional $53,325 |
| Immigrants | Serbia | 94.1 /100 | #126 | Exceptional $53,321 |
| Immigrants | North America | 93.9 /100 | #127 | Exceptional $53,307 |
| Immigrants | Bulgaria | 93.9 /100 | #128 | Exceptional $53,305 |
| New Zealanders | 93.7 /100 | #129 | Exceptional $53,294 |
| Nicaraguans | 93.4 /100 | #130 | Exceptional $53,275 |
| Immigrants | Nicaragua | 93.3 /100 | #131 | Exceptional $53,266 |