Lumbee vs Colombian Kindergarten
COMPARE
Lumbee
Colombian
Kindergarten
Kindergarten Comparison
Lumbee
Colombians
98.5%
KINDERGARTEN
99.9/ 100
METRIC RATING
43rd/ 347
METRIC RANK
97.7%
KINDERGARTEN
2.2/ 100
METRIC RATING
235th/ 347
METRIC RANK
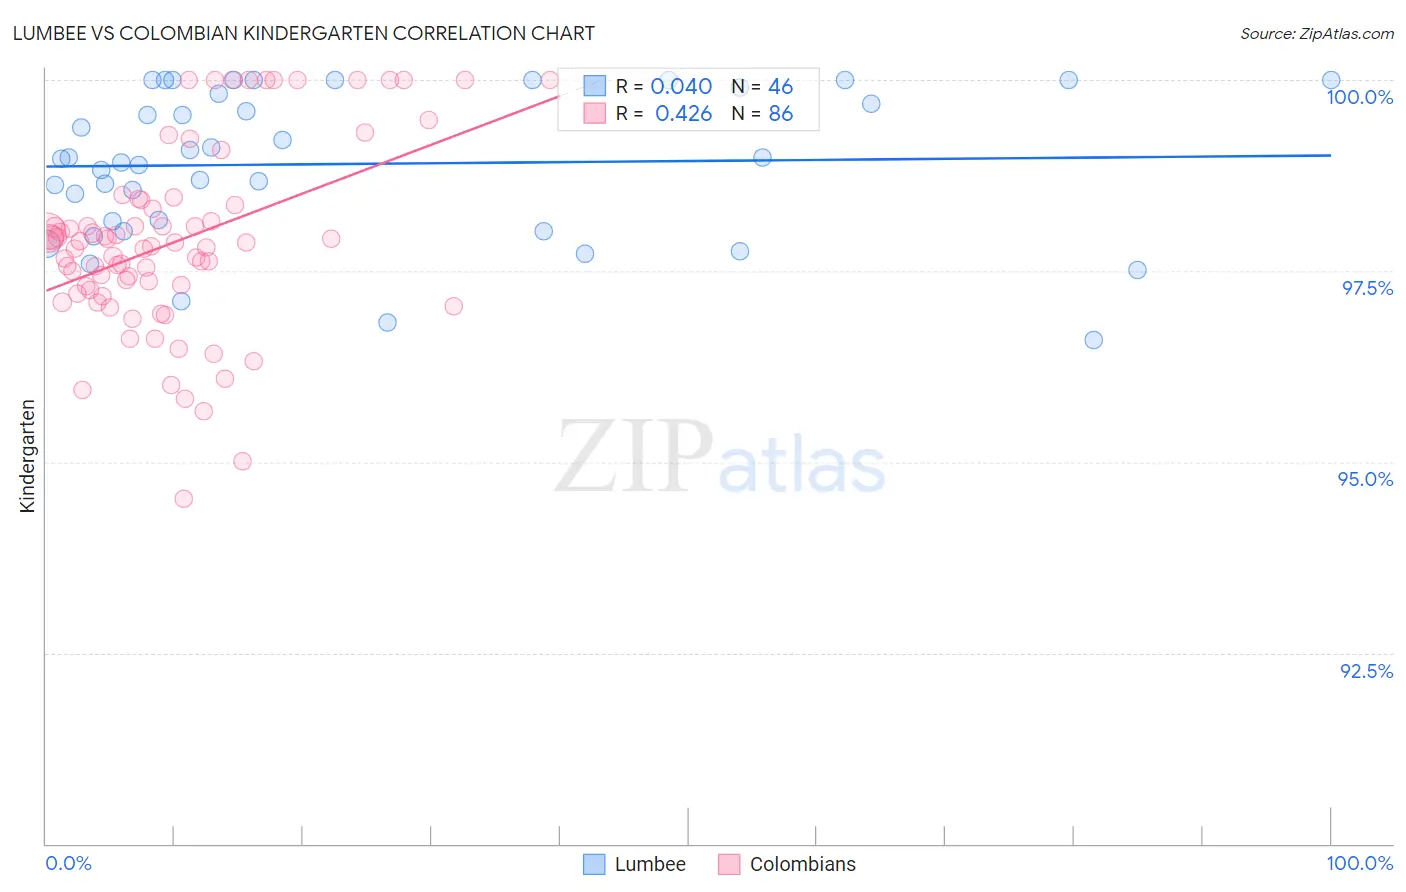
Lumbee vs Colombian Kindergarten Correlation Chart
The statistical analysis conducted on geographies consisting of 92,298,794 people shows no correlation between the proportion of Lumbee and percentage of population with at least kindergarten education in the United States with a correlation coefficient (R) of 0.040 and weighted average of 98.5%. Similarly, the statistical analysis conducted on geographies consisting of 419,700,680 people shows a moderate positive correlation between the proportion of Colombians and percentage of population with at least kindergarten education in the United States with a correlation coefficient (R) of 0.426 and weighted average of 97.7%, a difference of 0.83%.
Kindergarten Correlation Summary
| Measurement | Lumbee | Colombian |
| Minimum | 96.6% | 94.5% |
| Maximum | 100.0% | 100.0% |
| Range | 3.4% | 5.5% |
| Mean | 98.9% | 97.9% |
| Median | 99.0% | 97.8% |
| Interquartile 25% (IQ1) | 98.1% | 97.3% |
| Interquartile 75% (IQ3) | 99.9% | 98.4% |
| Interquartile Range (IQR) | 1.8% | 1.1% |
| Standard Deviation (Sample) | 0.96% | 1.2% |
| Standard Deviation (Population) | 0.95% | 1.2% |
Similar Demographics by Kindergarten
Demographics Similar to Lumbee by Kindergarten
In terms of kindergarten, the demographic groups most similar to Lumbee are Northern European (98.5%, a difference of 0.0%), Belgian (98.5%, a difference of 0.0%), Luxembourger (98.5%, a difference of 0.010%), Eastern European (98.5%, a difference of 0.010%), and Native Hawaiian (98.5%, a difference of 0.010%).
| Demographics | Rating | Rank | Kindergarten |
| British | 99.9 /100 | #36 | Exceptional 98.5% |
| Italians | 99.9 /100 | #37 | Exceptional 98.5% |
| Latvians | 99.9 /100 | #38 | Exceptional 98.5% |
| Chippewa | 99.9 /100 | #39 | Exceptional 98.5% |
| Luxembourgers | 99.9 /100 | #40 | Exceptional 98.5% |
| Eastern Europeans | 99.9 /100 | #41 | Exceptional 98.5% |
| Native Hawaiians | 99.9 /100 | #42 | Exceptional 98.5% |
| Lumbee | 99.9 /100 | #43 | Exceptional 98.5% |
| Northern Europeans | 99.9 /100 | #44 | Exceptional 98.5% |
| Belgians | 99.9 /100 | #45 | Exceptional 98.5% |
| Hungarians | 99.9 /100 | #46 | Exceptional 98.5% |
| Czechoslovakians | 99.8 /100 | #47 | Exceptional 98.4% |
| Ottawa | 99.8 /100 | #48 | Exceptional 98.4% |
| Kiowa | 99.8 /100 | #49 | Exceptional 98.4% |
| Whites/Caucasians | 99.8 /100 | #50 | Exceptional 98.4% |
Demographics Similar to Colombians by Kindergarten
In terms of kindergarten, the demographic groups most similar to Colombians are Immigrants from Pakistan (97.7%, a difference of 0.0%), Immigrants from Malaysia (97.7%, a difference of 0.0%), Immigrants from Western Asia (97.7%, a difference of 0.0%), Immigrants from Uruguay (97.7%, a difference of 0.010%), and Puerto Rican (97.7%, a difference of 0.020%).
| Demographics | Rating | Rank | Kindergarten |
| Sub-Saharan Africans | 3.5 /100 | #228 | Tragic 97.7% |
| Sierra Leoneans | 3.4 /100 | #229 | Tragic 97.7% |
| Senegalese | 3.3 /100 | #230 | Tragic 97.7% |
| Puerto Ricans | 2.7 /100 | #231 | Tragic 97.7% |
| Immigrants | Uruguay | 2.6 /100 | #232 | Tragic 97.7% |
| Immigrants | Pakistan | 2.2 /100 | #233 | Tragic 97.7% |
| Immigrants | Malaysia | 2.2 /100 | #234 | Tragic 97.7% |
| Colombians | 2.2 /100 | #235 | Tragic 97.7% |
| Immigrants | Western Asia | 2.1 /100 | #236 | Tragic 97.7% |
| Nigerians | 1.8 /100 | #237 | Tragic 97.6% |
| Immigrants | Eastern Asia | 1.7 /100 | #238 | Tragic 97.6% |
| U.S. Virgin Islanders | 1.7 /100 | #239 | Tragic 97.6% |
| Koreans | 1.6 /100 | #240 | Tragic 97.6% |
| Liberians | 1.3 /100 | #241 | Tragic 97.6% |
| Immigrants | Indonesia | 1.3 /100 | #242 | Tragic 97.6% |