Immigrants from Oceania vs Colombian 2 or more Vehicles in Household
COMPARE
Immigrants from Oceania
Colombian
2 or more Vehicles in Household
2 or more Vehicles in Household Comparison
Immigrants from Oceania
Colombians
57.5%
2 OR MORE VEHICLES IN HOUSEHOLD
98.2/ 100
METRIC RATING
106th/ 347
METRIC RANK
52.9%
2 OR MORE VEHICLES IN HOUSEHOLD
1.1/ 100
METRIC RATING
248th/ 347
METRIC RANK
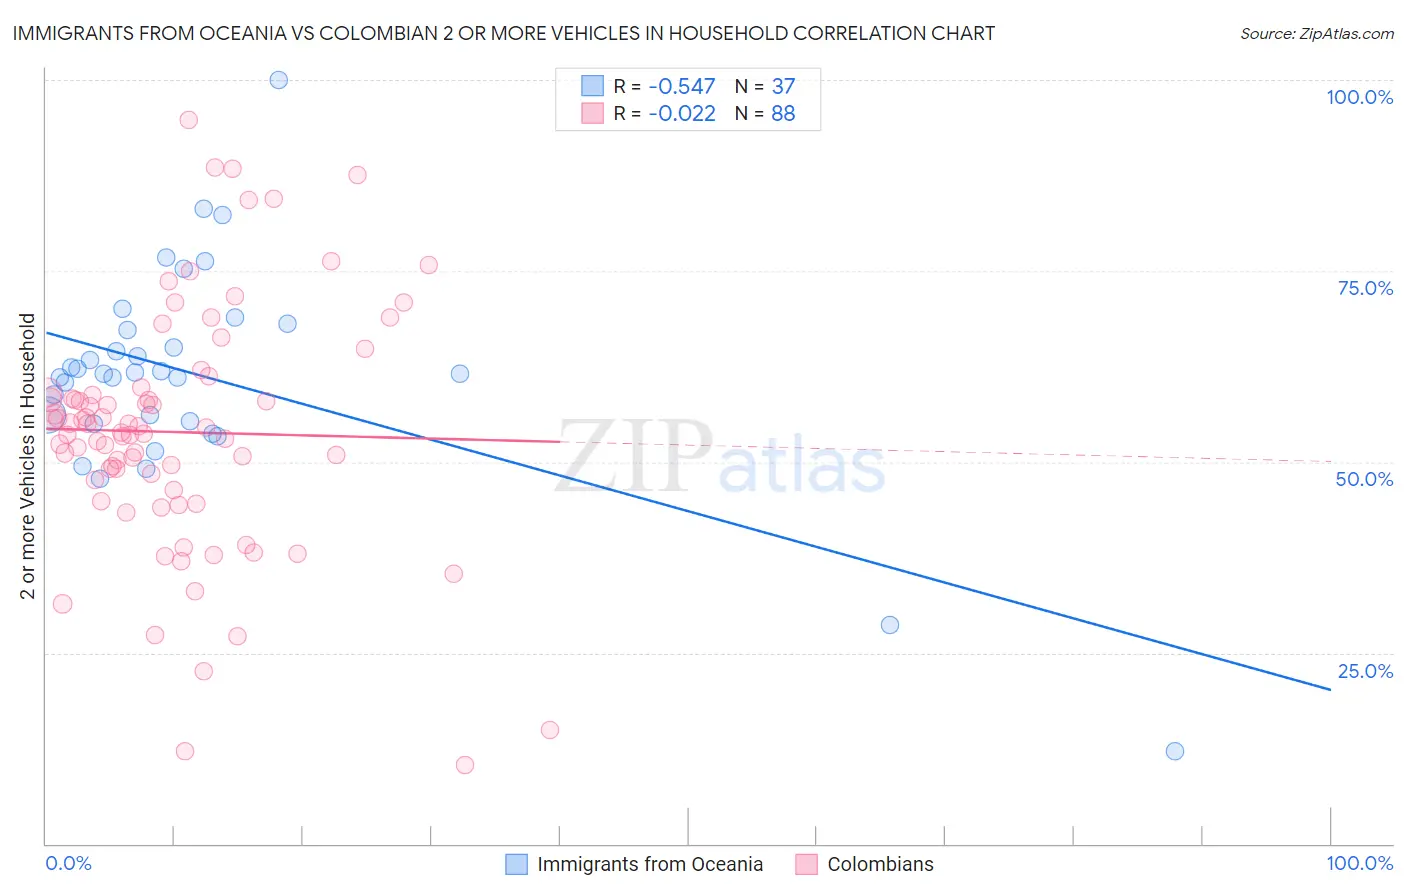
Immigrants from Oceania vs Colombian 2 or more Vehicles in Household Correlation Chart
The statistical analysis conducted on geographies consisting of 305,385,157 people shows a substantial negative correlation between the proportion of Immigrants from Oceania and percentage of households with 2 or more vehicles available in the United States with a correlation coefficient (R) of -0.547 and weighted average of 57.5%. Similarly, the statistical analysis conducted on geographies consisting of 419,364,720 people shows no correlation between the proportion of Colombians and percentage of households with 2 or more vehicles available in the United States with a correlation coefficient (R) of -0.022 and weighted average of 52.9%, a difference of 8.9%.
2 or more Vehicles in Household Correlation Summary
| Measurement | Immigrants from Oceania | Colombian |
| Minimum | 12.2% | 10.3% |
| Maximum | 100.0% | 94.8% |
| Range | 87.8% | 84.5% |
| Mean | 61.2% | 53.9% |
| Median | 61.5% | 54.2% |
| Interquartile 25% (IQ1) | 55.1% | 46.9% |
| Interquartile 75% (IQ3) | 67.7% | 58.9% |
| Interquartile Range (IQR) | 12.5% | 12.0% |
| Standard Deviation (Sample) | 14.6% | 16.1% |
| Standard Deviation (Population) | 14.4% | 16.0% |
Similar Demographics by 2 or more Vehicles in Household
Demographics Similar to Immigrants from Oceania by 2 or more Vehicles in Household
In terms of 2 or more vehicles in household, the demographic groups most similar to Immigrants from Oceania are Immigrants from Bolivia (57.6%, a difference of 0.020%), Jordanian (57.6%, a difference of 0.020%), Immigrants from Indonesia (57.6%, a difference of 0.020%), Immigrants from Korea (57.6%, a difference of 0.020%), and Immigrants from Netherlands (57.5%, a difference of 0.020%).
| Demographics | Rating | Rank | 2 or more Vehicles in Household |
| Cajuns | 98.5 /100 | #99 | Exceptional 57.7% |
| Fijians | 98.4 /100 | #100 | Exceptional 57.6% |
| Lebanese | 98.3 /100 | #101 | Exceptional 57.6% |
| Immigrants | Bolivia | 98.2 /100 | #102 | Exceptional 57.6% |
| Jordanians | 98.2 /100 | #103 | Exceptional 57.6% |
| Immigrants | Indonesia | 98.2 /100 | #104 | Exceptional 57.6% |
| Immigrants | Korea | 98.2 /100 | #105 | Exceptional 57.6% |
| Immigrants | Oceania | 98.2 /100 | #106 | Exceptional 57.5% |
| Immigrants | Netherlands | 98.2 /100 | #107 | Exceptional 57.5% |
| Immigrants | Canada | 98.1 /100 | #108 | Exceptional 57.5% |
| Immigrants | North America | 98.1 /100 | #109 | Exceptional 57.5% |
| Japanese | 98.0 /100 | #110 | Exceptional 57.5% |
| Greeks | 98.0 /100 | #111 | Exceptional 57.5% |
| Pueblo | 98.0 /100 | #112 | Exceptional 57.5% |
| Zimbabweans | 96.9 /100 | #113 | Exceptional 57.2% |
Demographics Similar to Colombians by 2 or more Vehicles in Household
In terms of 2 or more vehicles in household, the demographic groups most similar to Colombians are Immigrants from Brazil (52.8%, a difference of 0.060%), Mongolian (52.8%, a difference of 0.060%), Immigrants from Sudan (52.8%, a difference of 0.090%), Immigrants from Portugal (52.8%, a difference of 0.10%), and Sierra Leonean (52.9%, a difference of 0.12%).
| Demographics | Rating | Rank | 2 or more Vehicles in Household |
| Immigrants | Sierra Leone | 2.1 /100 | #241 | Tragic 53.2% |
| Immigrants | Eastern Asia | 2.1 /100 | #242 | Tragic 53.2% |
| Ethiopians | 1.7 /100 | #243 | Tragic 53.1% |
| Indians (Asian) | 1.7 /100 | #244 | Tragic 53.1% |
| Immigrants | Ethiopia | 1.5 /100 | #245 | Tragic 53.0% |
| Immigrants | Nigeria | 1.2 /100 | #246 | Tragic 52.9% |
| Sierra Leoneans | 1.2 /100 | #247 | Tragic 52.9% |
| Colombians | 1.1 /100 | #248 | Tragic 52.9% |
| Immigrants | Brazil | 1.0 /100 | #249 | Tragic 52.8% |
| Mongolians | 1.0 /100 | #250 | Tragic 52.8% |
| Immigrants | Sudan | 1.0 /100 | #251 | Tragic 52.8% |
| Immigrants | Portugal | 1.0 /100 | #252 | Tragic 52.8% |
| Nigerians | 0.9 /100 | #253 | Tragic 52.8% |
| Immigrants | Malaysia | 0.8 /100 | #254 | Tragic 52.7% |
| Uruguayans | 0.7 /100 | #255 | Tragic 52.7% |