Immigrants from Zaire vs Yaqui 4 or more Vehicles in Household
COMPARE
Immigrants from Zaire
Yaqui
4 or more Vehicles in Household
4 or more Vehicles in Household Comparison
Immigrants from Zaire
Yaqui
5.1%
4 OR MORE VEHICLES IN HOUSEHOLD
0.0/ 100
METRIC RATING
301st/ 347
METRIC RANK
8.1%
4 OR MORE VEHICLES IN HOUSEHOLD
100.0/ 100
METRIC RATING
33rd/ 347
METRIC RANK
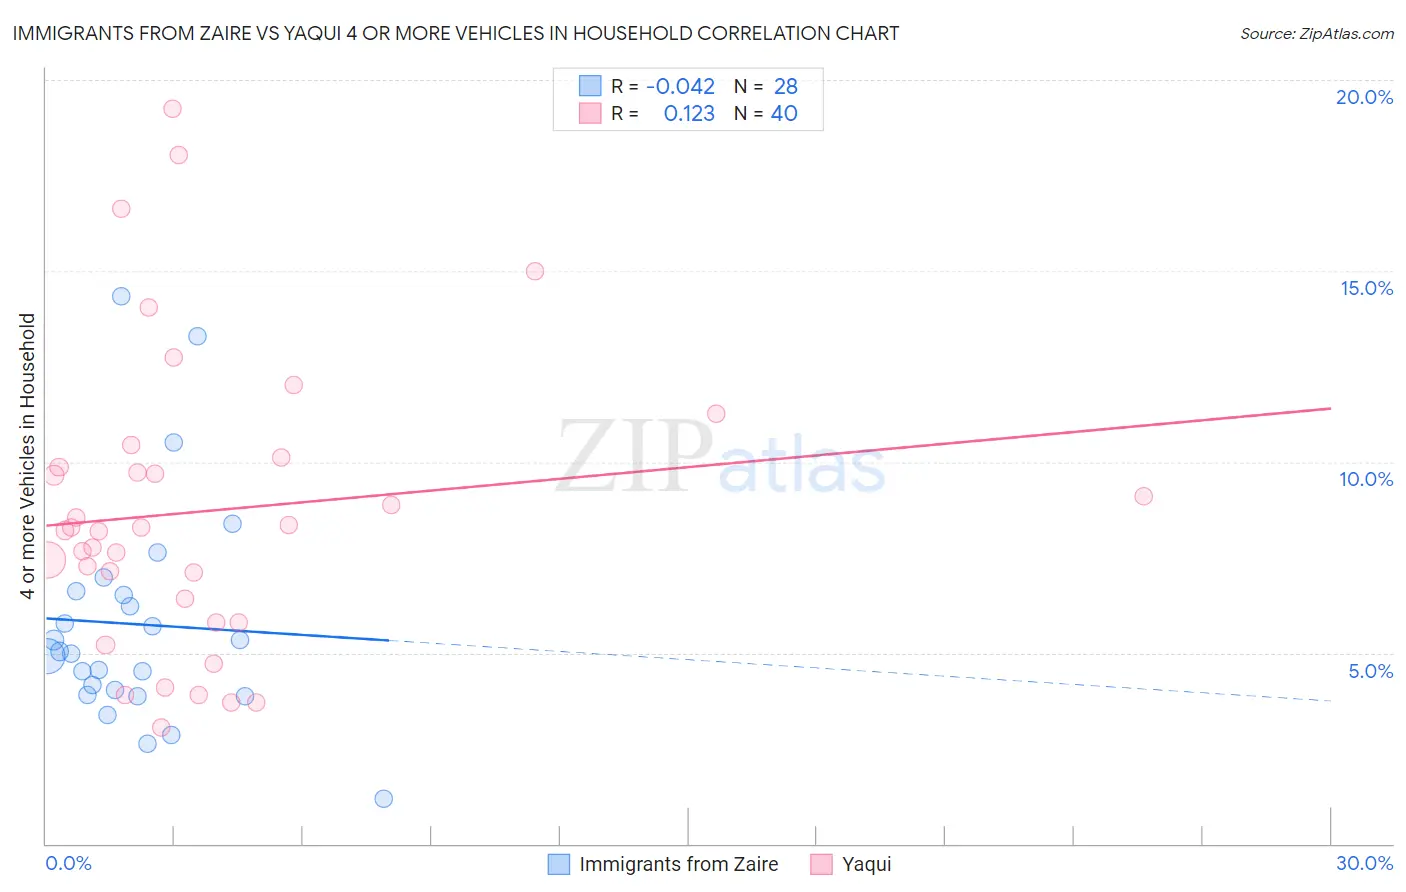
Immigrants from Zaire vs Yaqui 4 or more Vehicles in Household Correlation Chart
The statistical analysis conducted on geographies consisting of 106,897,629 people shows no correlation between the proportion of Immigrants from Zaire and percentage of households with 4 or more vehicles available in the United States with a correlation coefficient (R) of -0.042 and weighted average of 5.1%. Similarly, the statistical analysis conducted on geographies consisting of 107,689,121 people shows a poor positive correlation between the proportion of Yaqui and percentage of households with 4 or more vehicles available in the United States with a correlation coefficient (R) of 0.123 and weighted average of 8.1%, a difference of 59.5%.
4 or more Vehicles in Household Correlation Summary
| Measurement | Immigrants from Zaire | Yaqui |
| Minimum | 1.2% | 3.0% |
| Maximum | 14.3% | 19.2% |
| Range | 13.2% | 16.2% |
| Mean | 5.7% | 8.7% |
| Median | 5.0% | 8.2% |
| Interquartile 25% (IQ1) | 4.0% | 6.1% |
| Interquartile 75% (IQ3) | 6.6% | 10.0% |
| Interquartile Range (IQR) | 2.6% | 3.9% |
| Standard Deviation (Sample) | 2.9% | 3.9% |
| Standard Deviation (Population) | 2.9% | 3.8% |
Similar Demographics by 4 or more Vehicles in Household
Demographics Similar to Immigrants from Zaire by 4 or more Vehicles in Household
In terms of 4 or more vehicles in household, the demographic groups most similar to Immigrants from Zaire are Immigrants from Morocco (5.1%, a difference of 0.080%), Bahamian (5.1%, a difference of 0.31%), Immigrants from Greece (5.1%, a difference of 0.77%), Cypriot (5.0%, a difference of 1.3%), and Somali (5.0%, a difference of 1.3%).
| Demographics | Rating | Rank | 4 or more Vehicles in Household |
| Ghanaians | 0.1 /100 | #294 | Tragic 5.2% |
| Immigrants | Brazil | 0.1 /100 | #295 | Tragic 5.2% |
| Israelis | 0.1 /100 | #296 | Tragic 5.2% |
| Immigrants | Venezuela | 0.1 /100 | #297 | Tragic 5.2% |
| Immigrants | South America | 0.1 /100 | #298 | Tragic 5.2% |
| Immigrants | Ghana | 0.1 /100 | #299 | Tragic 5.2% |
| Immigrants | Morocco | 0.0 /100 | #300 | Tragic 5.1% |
| Immigrants | Zaire | 0.0 /100 | #301 | Tragic 5.1% |
| Bahamians | 0.0 /100 | #302 | Tragic 5.1% |
| Immigrants | Greece | 0.0 /100 | #303 | Tragic 5.1% |
| Cypriots | 0.0 /100 | #304 | Tragic 5.0% |
| Somalis | 0.0 /100 | #305 | Tragic 5.0% |
| Immigrants | Serbia | 0.0 /100 | #306 | Tragic 5.0% |
| Menominee | 0.0 /100 | #307 | Tragic 5.0% |
| Paraguayans | 0.0 /100 | #308 | Tragic 4.9% |
Demographics Similar to Yaqui by 4 or more Vehicles in Household
In terms of 4 or more vehicles in household, the demographic groups most similar to Yaqui are Marshallese (8.1%, a difference of 0.29%), Alaskan Athabascan (8.1%, a difference of 0.60%), Guamanian/Chamorro (8.1%, a difference of 0.80%), Native/Alaskan (8.2%, a difference of 0.82%), and Navajo (8.2%, a difference of 1.2%).
| Demographics | Rating | Rank | 4 or more Vehicles in Household |
| Mexican American Indians | 100.0 /100 | #26 | Exceptional 8.4% |
| Sri Lankans | 100.0 /100 | #27 | Exceptional 8.4% |
| Cheyenne | 100.0 /100 | #28 | Exceptional 8.3% |
| Immigrants | South Eastern Asia | 100.0 /100 | #29 | Exceptional 8.2% |
| Navajo | 100.0 /100 | #30 | Exceptional 8.2% |
| Natives/Alaskans | 100.0 /100 | #31 | Exceptional 8.2% |
| Marshallese | 100.0 /100 | #32 | Exceptional 8.1% |
| Yaqui | 100.0 /100 | #33 | Exceptional 8.1% |
| Alaskan Athabascans | 100.0 /100 | #34 | Exceptional 8.1% |
| Guamanians/Chamorros | 100.0 /100 | #35 | Exceptional 8.1% |
| Norwegians | 100.0 /100 | #36 | Exceptional 8.0% |
| Scandinavians | 100.0 /100 | #37 | Exceptional 8.0% |
| Sioux | 100.0 /100 | #38 | Exceptional 8.0% |
| Spanish Americans | 100.0 /100 | #39 | Exceptional 8.0% |
| Spanish | 100.0 /100 | #40 | Exceptional 7.9% |