Immigrants from Zaire vs Immigrants from Zimbabwe 4 or more Vehicles in Household
COMPARE
Immigrants from Zaire
Immigrants from Zimbabwe
4 or more Vehicles in Household
4 or more Vehicles in Household Comparison
Immigrants from Zaire
Immigrants from Zimbabwe
5.1%
4 OR MORE VEHICLES IN HOUSEHOLD
0.0/ 100
METRIC RATING
301st/ 347
METRIC RANK
6.0%
4 OR MORE VEHICLES IN HOUSEHOLD
15.1/ 100
METRIC RATING
210th/ 347
METRIC RANK
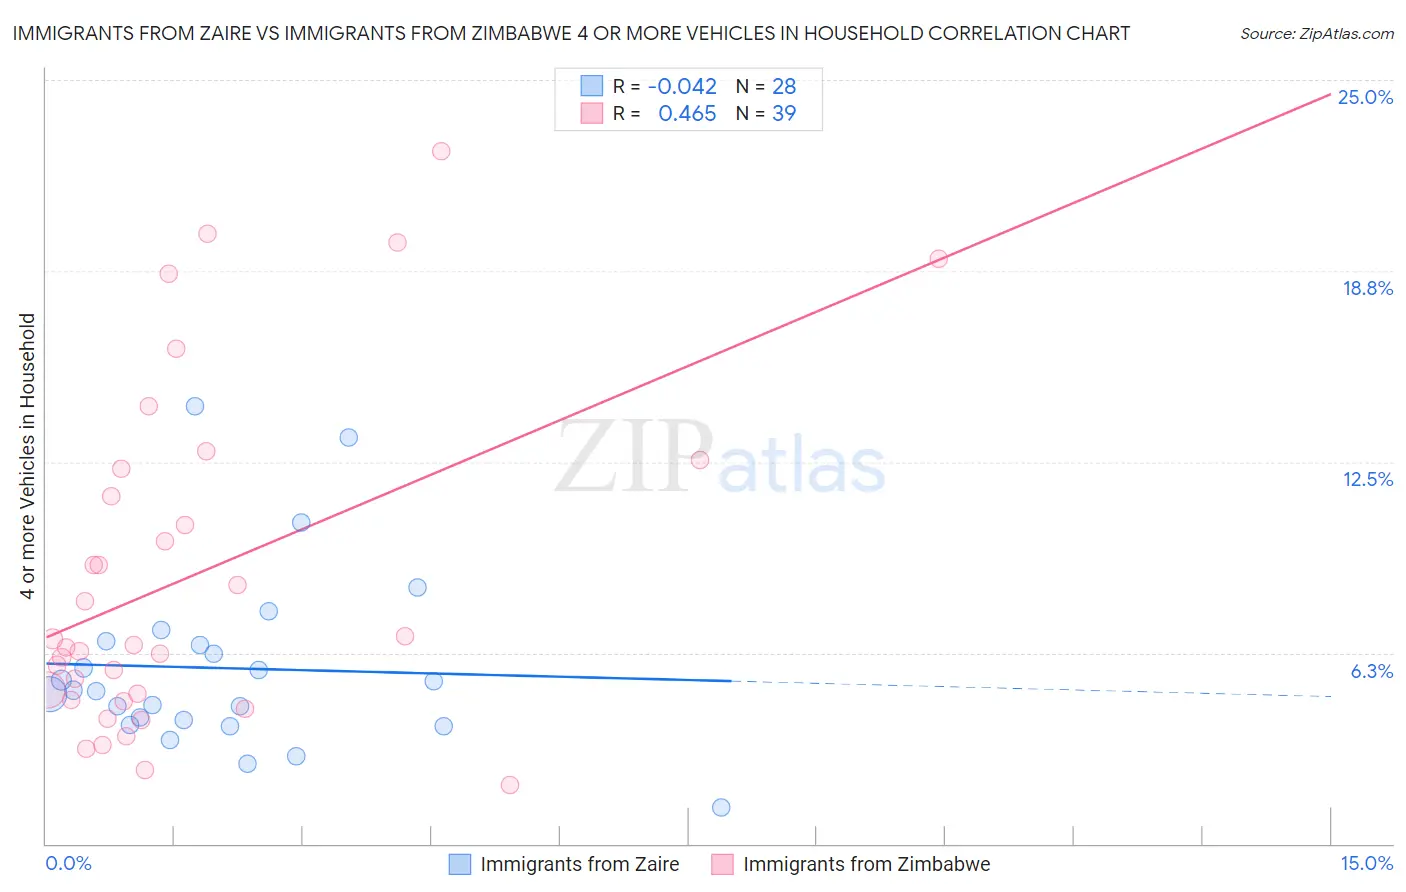
Immigrants from Zaire vs Immigrants from Zimbabwe 4 or more Vehicles in Household Correlation Chart
The statistical analysis conducted on geographies consisting of 106,897,629 people shows no correlation between the proportion of Immigrants from Zaire and percentage of households with 4 or more vehicles available in the United States with a correlation coefficient (R) of -0.042 and weighted average of 5.1%. Similarly, the statistical analysis conducted on geographies consisting of 117,555,035 people shows a moderate positive correlation between the proportion of Immigrants from Zimbabwe and percentage of households with 4 or more vehicles available in the United States with a correlation coefficient (R) of 0.465 and weighted average of 6.0%, a difference of 18.8%.
4 or more Vehicles in Household Correlation Summary
| Measurement | Immigrants from Zaire | Immigrants from Zimbabwe |
| Minimum | 1.2% | 1.9% |
| Maximum | 14.3% | 22.7% |
| Range | 13.2% | 20.7% |
| Mean | 5.7% | 8.8% |
| Median | 5.0% | 6.5% |
| Interquartile 25% (IQ1) | 4.0% | 4.7% |
| Interquartile 75% (IQ3) | 6.6% | 12.3% |
| Interquartile Range (IQR) | 2.6% | 7.6% |
| Standard Deviation (Sample) | 2.9% | 5.5% |
| Standard Deviation (Population) | 2.9% | 5.4% |
Similar Demographics by 4 or more Vehicles in Household
Demographics Similar to Immigrants from Zaire by 4 or more Vehicles in Household
In terms of 4 or more vehicles in household, the demographic groups most similar to Immigrants from Zaire are Immigrants from Morocco (5.1%, a difference of 0.080%), Bahamian (5.1%, a difference of 0.31%), Immigrants from Greece (5.1%, a difference of 0.77%), Cypriot (5.0%, a difference of 1.3%), and Somali (5.0%, a difference of 1.3%).
| Demographics | Rating | Rank | 4 or more Vehicles in Household |
| Ghanaians | 0.1 /100 | #294 | Tragic 5.2% |
| Immigrants | Brazil | 0.1 /100 | #295 | Tragic 5.2% |
| Israelis | 0.1 /100 | #296 | Tragic 5.2% |
| Immigrants | Venezuela | 0.1 /100 | #297 | Tragic 5.2% |
| Immigrants | South America | 0.1 /100 | #298 | Tragic 5.2% |
| Immigrants | Ghana | 0.1 /100 | #299 | Tragic 5.2% |
| Immigrants | Morocco | 0.0 /100 | #300 | Tragic 5.1% |
| Immigrants | Zaire | 0.0 /100 | #301 | Tragic 5.1% |
| Bahamians | 0.0 /100 | #302 | Tragic 5.1% |
| Immigrants | Greece | 0.0 /100 | #303 | Tragic 5.1% |
| Cypriots | 0.0 /100 | #304 | Tragic 5.0% |
| Somalis | 0.0 /100 | #305 | Tragic 5.0% |
| Immigrants | Serbia | 0.0 /100 | #306 | Tragic 5.0% |
| Menominee | 0.0 /100 | #307 | Tragic 5.0% |
| Paraguayans | 0.0 /100 | #308 | Tragic 4.9% |
Demographics Similar to Immigrants from Zimbabwe by 4 or more Vehicles in Household
In terms of 4 or more vehicles in household, the demographic groups most similar to Immigrants from Zimbabwe are Immigrants from Honduras (6.1%, a difference of 0.050%), Panamanian (6.0%, a difference of 0.080%), Immigrants from Nigeria (6.1%, a difference of 0.090%), Immigrants from Egypt (6.0%, a difference of 0.10%), and Arab (6.0%, a difference of 0.15%).
| Demographics | Rating | Rank | 4 or more Vehicles in Household |
| Immigrants | Sierra Leone | 20.5 /100 | #203 | Fair 6.1% |
| Immigrants | Belize | 19.8 /100 | #204 | Poor 6.1% |
| Hondurans | 19.3 /100 | #205 | Poor 6.1% |
| Kenyans | 18.5 /100 | #206 | Poor 6.1% |
| Immigrants | Chile | 16.9 /100 | #207 | Poor 6.1% |
| Immigrants | Nigeria | 15.6 /100 | #208 | Poor 6.1% |
| Immigrants | Honduras | 15.4 /100 | #209 | Poor 6.1% |
| Immigrants | Zimbabwe | 15.1 /100 | #210 | Poor 6.0% |
| Panamanians | 14.8 /100 | #211 | Poor 6.0% |
| Immigrants | Egypt | 14.7 /100 | #212 | Poor 6.0% |
| Arabs | 14.4 /100 | #213 | Poor 6.0% |
| Immigrants | Austria | 14.3 /100 | #214 | Poor 6.0% |
| Immigrants | China | 13.8 /100 | #215 | Poor 6.0% |
| Immigrants | Romania | 13.8 /100 | #216 | Poor 6.0% |
| Nigerians | 12.2 /100 | #217 | Poor 6.0% |