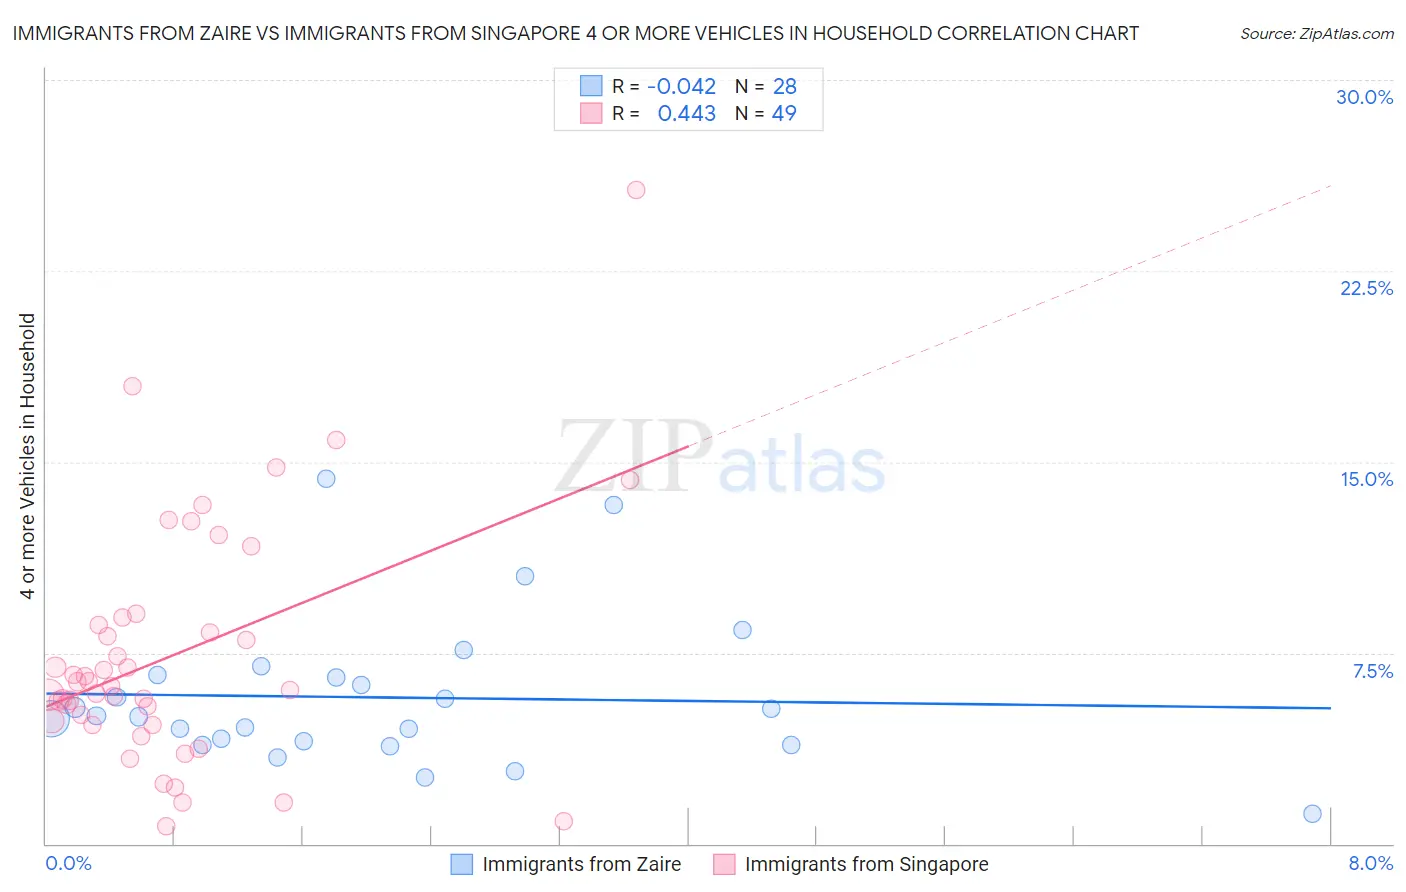
Immigrants from Zaire vs Immigrants from Singapore 4 or more Vehicles in Household
COMPARE
Immigrants from Zaire
Immigrants from Singapore
4 or more Vehicles in Household
4 or more Vehicles in Household Comparison
Immigrants from Zaire
Immigrants from Singapore
5.1%
4 OR MORE VEHICLES IN HOUSEHOLD
0.0/ 100
METRIC RATING
301st/ 347
METRIC RANK
5.9%
4 OR MORE VEHICLES IN HOUSEHOLD
7.9/ 100
METRIC RATING
226th/ 347
METRIC RANK
Immigrants from Zaire vs Immigrants from Singapore 4 or more Vehicles in Household Correlation Chart
The statistical analysis conducted on geographies consisting of 106,897,629 people shows no correlation between the proportion of Immigrants from Zaire and percentage of households with 4 or more vehicles available in the United States with a correlation coefficient (R) of -0.042 and weighted average of 5.1%. Similarly, the statistical analysis conducted on geographies consisting of 136,732,831 people shows a moderate positive correlation between the proportion of Immigrants from Singapore and percentage of households with 4 or more vehicles available in the United States with a correlation coefficient (R) of 0.443 and weighted average of 5.9%, a difference of 16.5%.
4 or more Vehicles in Household Correlation Summary
| Measurement | Immigrants from Zaire | Immigrants from Singapore |
| Minimum | 1.2% | 0.67% |
| Maximum | 14.3% | 25.7% |
| Range | 13.2% | 25.0% |
| Mean | 5.7% | 7.4% |
| Median | 5.0% | 6.2% |
| Interquartile 25% (IQ1) | 4.0% | 4.7% |
| Interquartile 75% (IQ3) | 6.6% | 8.7% |
| Interquartile Range (IQR) | 2.6% | 4.0% |
| Standard Deviation (Sample) | 2.9% | 4.7% |
| Standard Deviation (Population) | 2.9% | 4.7% |
Similar Demographics by 4 or more Vehicles in Household
Demographics Similar to Immigrants from Zaire by 4 or more Vehicles in Household
In terms of 4 or more vehicles in household, the demographic groups most similar to Immigrants from Zaire are Immigrants from Morocco (5.1%, a difference of 0.080%), Bahamian (5.1%, a difference of 0.31%), Immigrants from Greece (5.1%, a difference of 0.77%), Cypriot (5.0%, a difference of 1.3%), and Somali (5.0%, a difference of 1.3%).
| Demographics | Rating | Rank | 4 or more Vehicles in Household |
| Ghanaians | 0.1 /100 | #294 | Tragic 5.2% |
| Immigrants | Brazil | 0.1 /100 | #295 | Tragic 5.2% |
| Israelis | 0.1 /100 | #296 | Tragic 5.2% |
| Immigrants | Venezuela | 0.1 /100 | #297 | Tragic 5.2% |
| Immigrants | South America | 0.1 /100 | #298 | Tragic 5.2% |
| Immigrants | Ghana | 0.1 /100 | #299 | Tragic 5.2% |
| Immigrants | Morocco | 0.0 /100 | #300 | Tragic 5.1% |
| Immigrants | Zaire | 0.0 /100 | #301 | Tragic 5.1% |
| Bahamians | 0.0 /100 | #302 | Tragic 5.1% |
| Immigrants | Greece | 0.0 /100 | #303 | Tragic 5.1% |
| Cypriots | 0.0 /100 | #304 | Tragic 5.0% |
| Somalis | 0.0 /100 | #305 | Tragic 5.0% |
| Immigrants | Serbia | 0.0 /100 | #306 | Tragic 5.0% |
| Menominee | 0.0 /100 | #307 | Tragic 5.0% |
| Paraguayans | 0.0 /100 | #308 | Tragic 4.9% |
Demographics Similar to Immigrants from Singapore by 4 or more Vehicles in Household
In terms of 4 or more vehicles in household, the demographic groups most similar to Immigrants from Singapore are Immigrants from Western Asia (5.9%, a difference of 0.040%), Immigrants from Uganda (5.9%, a difference of 0.13%), Indonesian (6.0%, a difference of 0.38%), Eastern European (5.9%, a difference of 0.41%), and Cuban (6.0%, a difference of 0.46%).
| Demographics | Rating | Rank | 4 or more Vehicles in Household |
| Serbians | 11.0 /100 | #219 | Poor 6.0% |
| Russians | 10.3 /100 | #220 | Poor 6.0% |
| Immigrants | Moldova | 9.3 /100 | #221 | Tragic 6.0% |
| Cajuns | 9.2 /100 | #222 | Tragic 6.0% |
| Immigrants | Kenya | 9.2 /100 | #223 | Tragic 6.0% |
| Cubans | 9.2 /100 | #224 | Tragic 6.0% |
| Indonesians | 8.9 /100 | #225 | Tragic 6.0% |
| Immigrants | Singapore | 7.9 /100 | #226 | Tragic 5.9% |
| Immigrants | Western Asia | 7.8 /100 | #227 | Tragic 5.9% |
| Immigrants | Uganda | 7.5 /100 | #228 | Tragic 5.9% |
| Eastern Europeans | 6.8 /100 | #229 | Tragic 5.9% |
| Immigrants | Malaysia | 6.7 /100 | #230 | Tragic 5.9% |
| Immigrants | Switzerland | 6.4 /100 | #231 | Tragic 5.9% |
| Immigrants | Argentina | 6.0 /100 | #232 | Tragic 5.9% |
| Sierra Leoneans | 6.0 /100 | #233 | Tragic 5.9% |