Immigrants from Zaire vs South African 4 or more Vehicles in Household
COMPARE
Immigrants from Zaire
South African
4 or more Vehicles in Household
4 or more Vehicles in Household Comparison
Immigrants from Zaire
South Africans
5.1%
4 OR MORE VEHICLES IN HOUSEHOLD
0.0/ 100
METRIC RATING
301st/ 347
METRIC RANK
6.2%
4 OR MORE VEHICLES IN HOUSEHOLD
32.2/ 100
METRIC RATING
190th/ 347
METRIC RANK
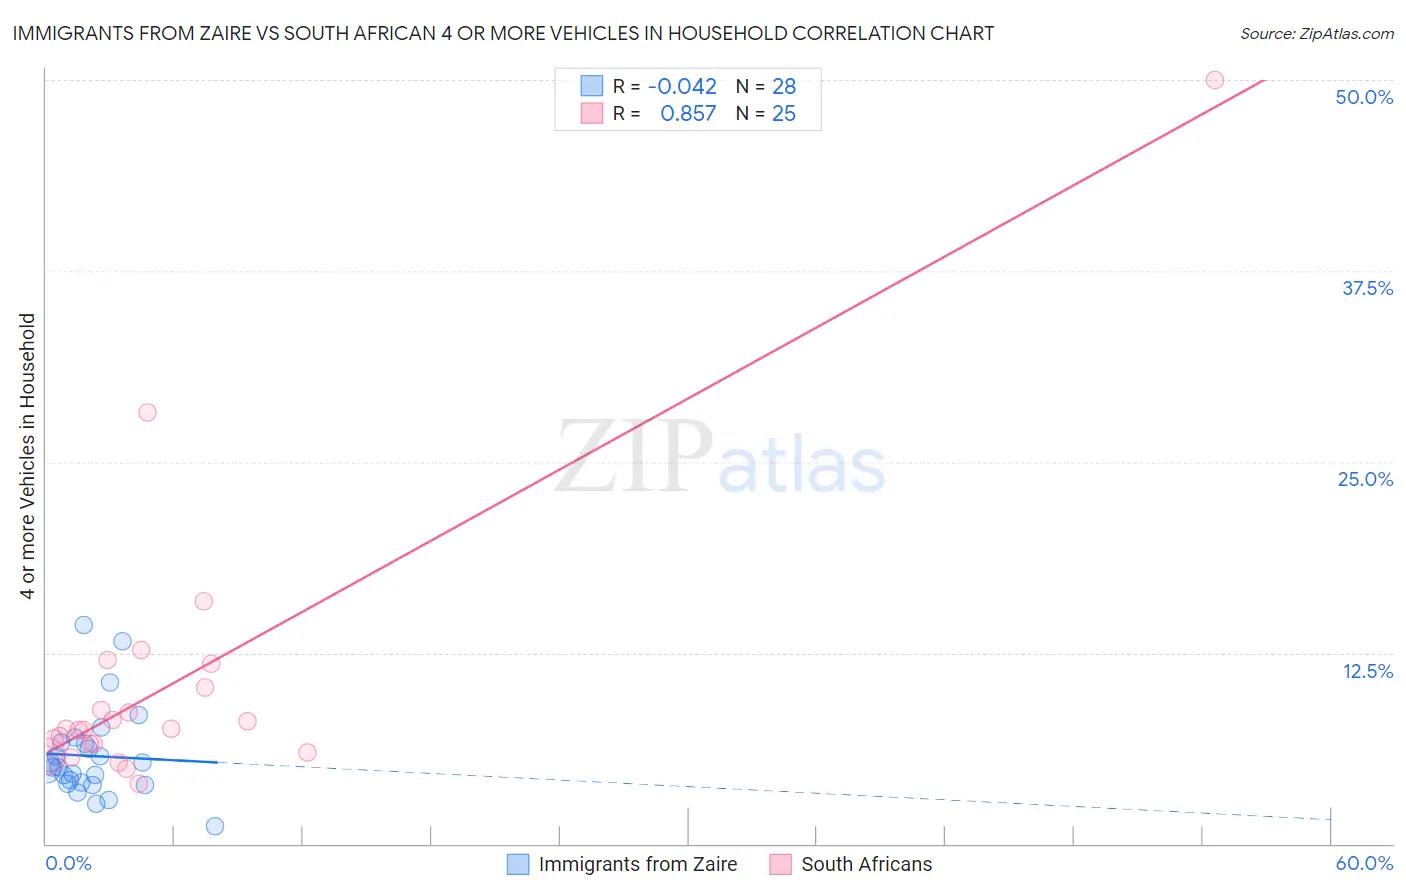
Immigrants from Zaire vs South African 4 or more Vehicles in Household Correlation Chart
The statistical analysis conducted on geographies consisting of 106,897,629 people shows no correlation between the proportion of Immigrants from Zaire and percentage of households with 4 or more vehicles available in the United States with a correlation coefficient (R) of -0.042 and weighted average of 5.1%. Similarly, the statistical analysis conducted on geographies consisting of 181,747,676 people shows a very strong positive correlation between the proportion of South Africans and percentage of households with 4 or more vehicles available in the United States with a correlation coefficient (R) of 0.857 and weighted average of 6.2%, a difference of 21.9%.
4 or more Vehicles in Household Correlation Summary
| Measurement | Immigrants from Zaire | South African |
| Minimum | 1.2% | 3.9% |
| Maximum | 14.3% | 50.0% |
| Range | 13.2% | 46.1% |
| Mean | 5.7% | 10.5% |
| Median | 5.0% | 7.5% |
| Interquartile 25% (IQ1) | 4.0% | 6.2% |
| Interquartile 75% (IQ3) | 6.6% | 11.0% |
| Interquartile Range (IQR) | 2.6% | 4.8% |
| Standard Deviation (Sample) | 2.9% | 9.6% |
| Standard Deviation (Population) | 2.9% | 9.4% |
Similar Demographics by 4 or more Vehicles in Household
Demographics Similar to Immigrants from Zaire by 4 or more Vehicles in Household
In terms of 4 or more vehicles in household, the demographic groups most similar to Immigrants from Zaire are Immigrants from Morocco (5.1%, a difference of 0.080%), Bahamian (5.1%, a difference of 0.31%), Immigrants from Greece (5.1%, a difference of 0.77%), Cypriot (5.0%, a difference of 1.3%), and Somali (5.0%, a difference of 1.3%).
| Demographics | Rating | Rank | 4 or more Vehicles in Household |
| Ghanaians | 0.1 /100 | #294 | Tragic 5.2% |
| Immigrants | Brazil | 0.1 /100 | #295 | Tragic 5.2% |
| Israelis | 0.1 /100 | #296 | Tragic 5.2% |
| Immigrants | Venezuela | 0.1 /100 | #297 | Tragic 5.2% |
| Immigrants | South America | 0.1 /100 | #298 | Tragic 5.2% |
| Immigrants | Ghana | 0.1 /100 | #299 | Tragic 5.2% |
| Immigrants | Morocco | 0.0 /100 | #300 | Tragic 5.1% |
| Immigrants | Zaire | 0.0 /100 | #301 | Tragic 5.1% |
| Bahamians | 0.0 /100 | #302 | Tragic 5.1% |
| Immigrants | Greece | 0.0 /100 | #303 | Tragic 5.1% |
| Cypriots | 0.0 /100 | #304 | Tragic 5.0% |
| Somalis | 0.0 /100 | #305 | Tragic 5.0% |
| Immigrants | Serbia | 0.0 /100 | #306 | Tragic 5.0% |
| Menominee | 0.0 /100 | #307 | Tragic 5.0% |
| Paraguayans | 0.0 /100 | #308 | Tragic 4.9% |
Demographics Similar to South Africans by 4 or more Vehicles in Household
In terms of 4 or more vehicles in household, the demographic groups most similar to South Africans are Immigrants from Eastern Asia (6.2%, a difference of 0.12%), Inupiat (6.2%, a difference of 0.18%), Romanian (6.2%, a difference of 0.19%), Kiowa (6.2%, a difference of 0.29%), and Immigrants from South Africa (6.2%, a difference of 0.36%).
| Demographics | Rating | Rank | 4 or more Vehicles in Household |
| Immigrants | Burma/Myanmar | 37.5 /100 | #183 | Fair 6.2% |
| Iraqis | 37.3 /100 | #184 | Fair 6.2% |
| Thais | 36.9 /100 | #185 | Fair 6.2% |
| Immigrants | Northern Europe | 36.8 /100 | #186 | Fair 6.2% |
| Immigrants | South Africa | 35.4 /100 | #187 | Fair 6.2% |
| Kiowa | 34.7 /100 | #188 | Fair 6.2% |
| Immigrants | Eastern Asia | 33.3 /100 | #189 | Fair 6.2% |
| South Africans | 32.2 /100 | #190 | Fair 6.2% |
| Inupiat | 30.7 /100 | #191 | Fair 6.2% |
| Romanians | 30.7 /100 | #192 | Fair 6.2% |
| Immigrants | Kuwait | 28.0 /100 | #193 | Fair 6.2% |
| Immigrants | Sweden | 27.0 /100 | #194 | Fair 6.2% |
| Argentineans | 27.0 /100 | #195 | Fair 6.2% |
| Tsimshian | 26.4 /100 | #196 | Fair 6.2% |
| Immigrants | Sri Lanka | 23.7 /100 | #197 | Fair 6.1% |