Immigrants from Zaire vs Immigrants from Australia 4 or more Vehicles in Household
COMPARE
Immigrants from Zaire
Immigrants from Australia
4 or more Vehicles in Household
4 or more Vehicles in Household Comparison
Immigrants from Zaire
Immigrants from Australia
5.1%
4 OR MORE VEHICLES IN HOUSEHOLD
0.0/ 100
METRIC RATING
301st/ 347
METRIC RANK
5.8%
4 OR MORE VEHICLES IN HOUSEHOLD
3.8/ 100
METRIC RATING
239th/ 347
METRIC RANK
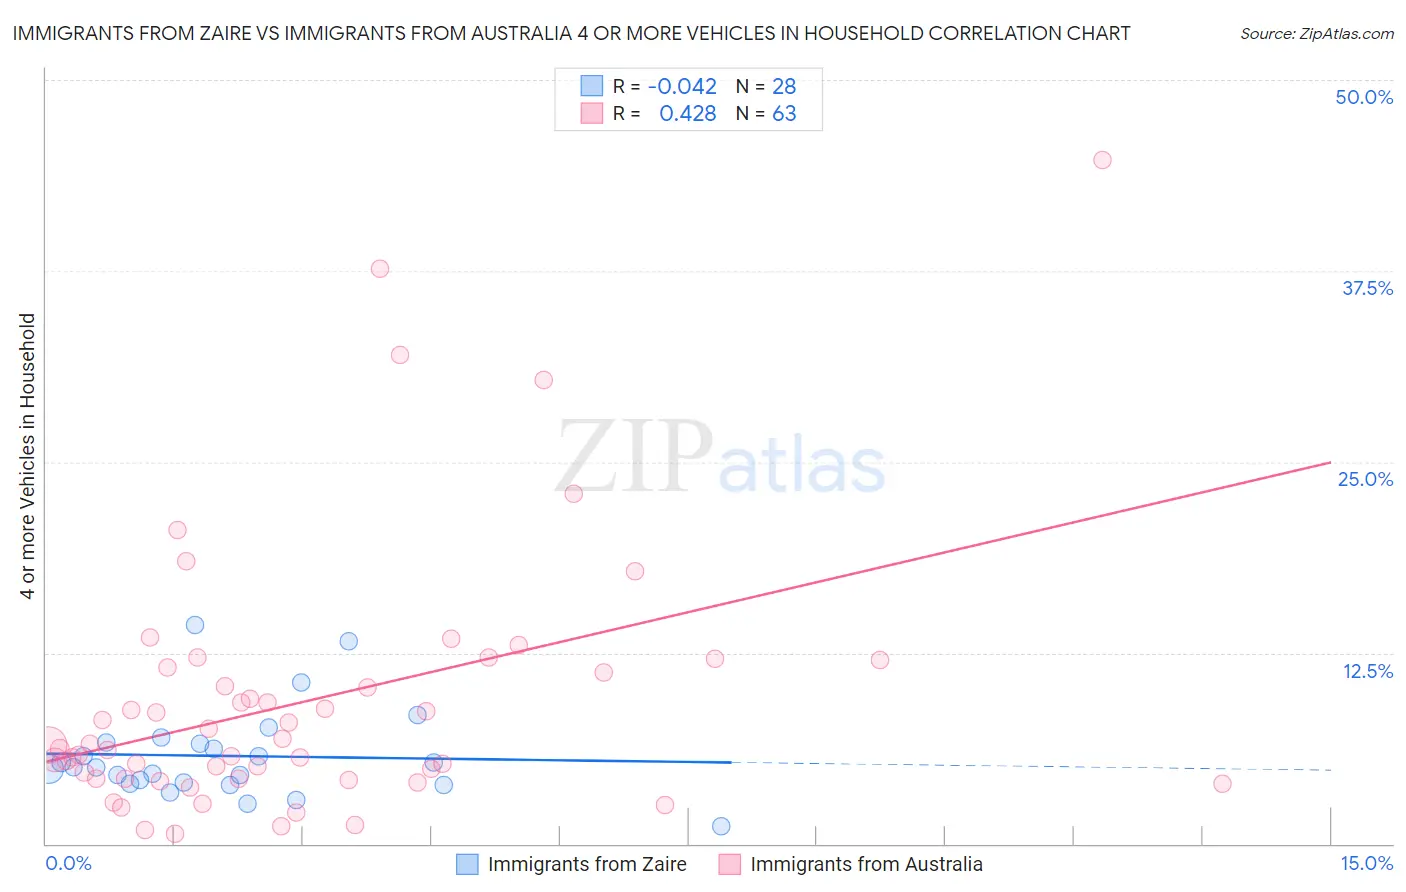
Immigrants from Zaire vs Immigrants from Australia 4 or more Vehicles in Household Correlation Chart
The statistical analysis conducted on geographies consisting of 106,897,629 people shows no correlation between the proportion of Immigrants from Zaire and percentage of households with 4 or more vehicles available in the United States with a correlation coefficient (R) of -0.042 and weighted average of 5.1%. Similarly, the statistical analysis conducted on geographies consisting of 226,216,978 people shows a moderate positive correlation between the proportion of Immigrants from Australia and percentage of households with 4 or more vehicles available in the United States with a correlation coefficient (R) of 0.428 and weighted average of 5.8%, a difference of 14.1%.
4 or more Vehicles in Household Correlation Summary
| Measurement | Immigrants from Zaire | Immigrants from Australia |
| Minimum | 1.2% | 0.65% |
| Maximum | 14.3% | 44.7% |
| Range | 13.2% | 44.1% |
| Mean | 5.7% | 9.3% |
| Median | 5.0% | 6.5% |
| Interquartile 25% (IQ1) | 4.0% | 4.2% |
| Interquartile 75% (IQ3) | 6.6% | 11.6% |
| Interquartile Range (IQR) | 2.6% | 7.3% |
| Standard Deviation (Sample) | 2.9% | 8.6% |
| Standard Deviation (Population) | 2.9% | 8.5% |
Similar Demographics by 4 or more Vehicles in Household
Demographics Similar to Immigrants from Zaire by 4 or more Vehicles in Household
In terms of 4 or more vehicles in household, the demographic groups most similar to Immigrants from Zaire are Immigrants from Morocco (5.1%, a difference of 0.080%), Bahamian (5.1%, a difference of 0.31%), Immigrants from Greece (5.1%, a difference of 0.77%), Cypriot (5.0%, a difference of 1.3%), and Somali (5.0%, a difference of 1.3%).
| Demographics | Rating | Rank | 4 or more Vehicles in Household |
| Ghanaians | 0.1 /100 | #294 | Tragic 5.2% |
| Immigrants | Brazil | 0.1 /100 | #295 | Tragic 5.2% |
| Israelis | 0.1 /100 | #296 | Tragic 5.2% |
| Immigrants | Venezuela | 0.1 /100 | #297 | Tragic 5.2% |
| Immigrants | South America | 0.1 /100 | #298 | Tragic 5.2% |
| Immigrants | Ghana | 0.1 /100 | #299 | Tragic 5.2% |
| Immigrants | Morocco | 0.0 /100 | #300 | Tragic 5.1% |
| Immigrants | Zaire | 0.0 /100 | #301 | Tragic 5.1% |
| Bahamians | 0.0 /100 | #302 | Tragic 5.1% |
| Immigrants | Greece | 0.0 /100 | #303 | Tragic 5.1% |
| Cypriots | 0.0 /100 | #304 | Tragic 5.0% |
| Somalis | 0.0 /100 | #305 | Tragic 5.0% |
| Immigrants | Serbia | 0.0 /100 | #306 | Tragic 5.0% |
| Menominee | 0.0 /100 | #307 | Tragic 5.0% |
| Paraguayans | 0.0 /100 | #308 | Tragic 4.9% |
Demographics Similar to Immigrants from Australia by 4 or more Vehicles in Household
In terms of 4 or more vehicles in household, the demographic groups most similar to Immigrants from Australia are Immigrants from Poland (5.8%, a difference of 0.040%), Immigrants from Belgium (5.8%, a difference of 0.090%), Mongolian (5.8%, a difference of 0.14%), Turkish (5.8%, a difference of 0.22%), and Immigrants from Middle Africa (5.8%, a difference of 0.35%).
| Demographics | Rating | Rank | 4 or more Vehicles in Household |
| Immigrants | Argentina | 6.0 /100 | #232 | Tragic 5.9% |
| Sierra Leoneans | 6.0 /100 | #233 | Tragic 5.9% |
| Africans | 4.6 /100 | #234 | Tragic 5.8% |
| Immigrants | Hungary | 4.6 /100 | #235 | Tragic 5.8% |
| Immigrants | Eritrea | 4.5 /100 | #236 | Tragic 5.8% |
| Turks | 4.1 /100 | #237 | Tragic 5.8% |
| Immigrants | Belgium | 4.0 /100 | #238 | Tragic 5.8% |
| Immigrants | Australia | 3.8 /100 | #239 | Tragic 5.8% |
| Immigrants | Poland | 3.8 /100 | #240 | Tragic 5.8% |
| Mongolians | 3.7 /100 | #241 | Tragic 5.8% |
| Immigrants | Middle Africa | 3.4 /100 | #242 | Tragic 5.8% |
| Immigrants | Czechoslovakia | 3.2 /100 | #243 | Tragic 5.8% |
| Ethiopians | 3.2 /100 | #244 | Tragic 5.8% |
| Bulgarians | 3.1 /100 | #245 | Tragic 5.8% |
| Immigrants | North Macedonia | 2.5 /100 | #246 | Tragic 5.7% |