Immigrants from Somalia vs Yaqui 4 or more Vehicles in Household
COMPARE
Immigrants from Somalia
Yaqui
4 or more Vehicles in Household
4 or more Vehicles in Household Comparison
Immigrants from Somalia
Yaqui
4.9%
4 OR MORE VEHICLES IN HOUSEHOLD
0.0/ 100
METRIC RATING
309th/ 347
METRIC RANK
8.1%
4 OR MORE VEHICLES IN HOUSEHOLD
100.0/ 100
METRIC RATING
33rd/ 347
METRIC RANK
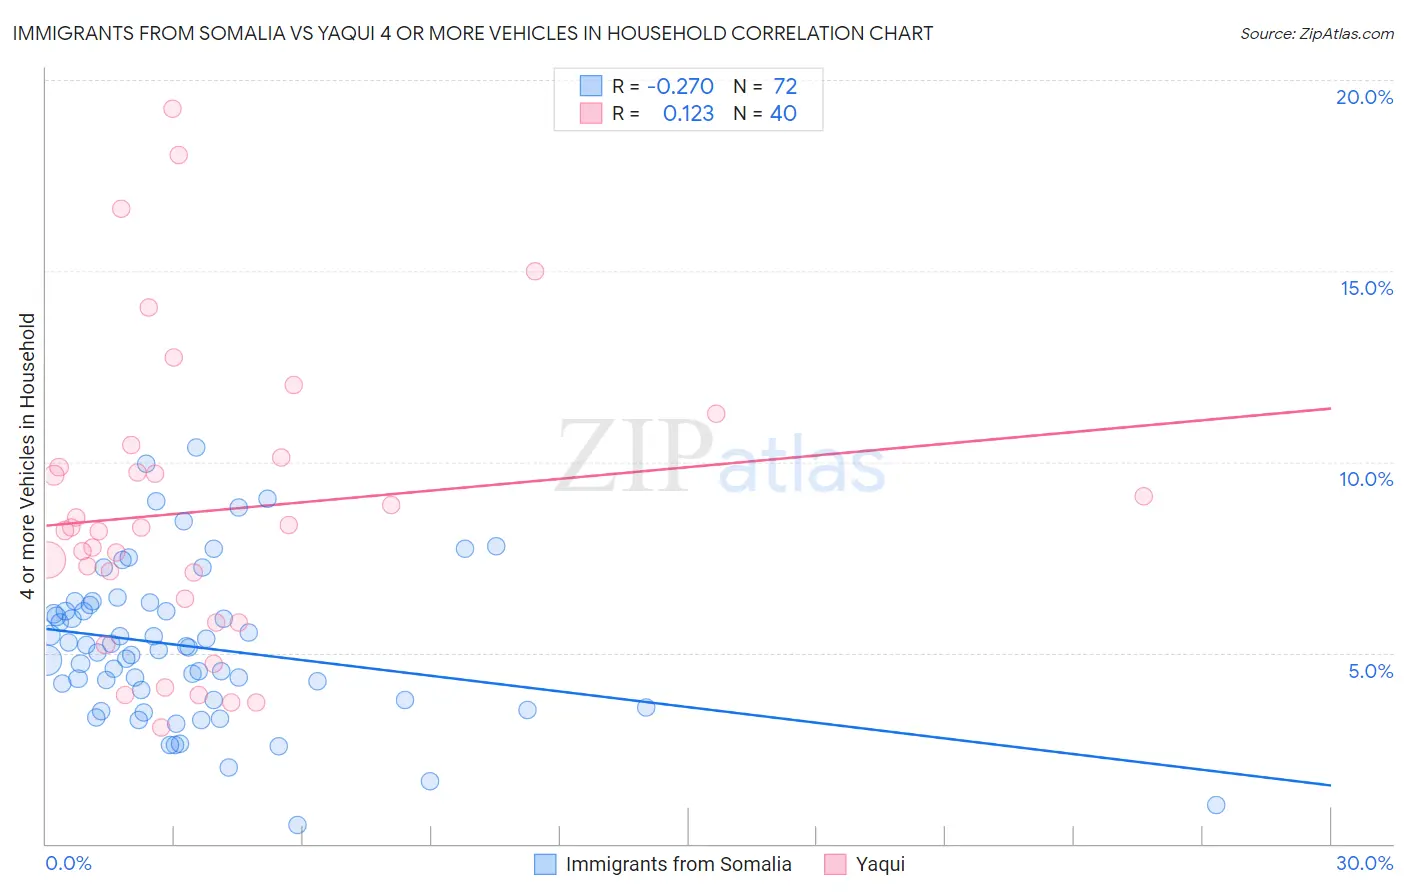
Immigrants from Somalia vs Yaqui 4 or more Vehicles in Household Correlation Chart
The statistical analysis conducted on geographies consisting of 91,954,099 people shows a weak negative correlation between the proportion of Immigrants from Somalia and percentage of households with 4 or more vehicles available in the United States with a correlation coefficient (R) of -0.270 and weighted average of 4.9%. Similarly, the statistical analysis conducted on geographies consisting of 107,689,121 people shows a poor positive correlation between the proportion of Yaqui and percentage of households with 4 or more vehicles available in the United States with a correlation coefficient (R) of 0.123 and weighted average of 8.1%, a difference of 64.7%.
4 or more Vehicles in Household Correlation Summary
| Measurement | Immigrants from Somalia | Yaqui |
| Minimum | 0.49% | 3.0% |
| Maximum | 10.4% | 19.2% |
| Range | 9.9% | 16.2% |
| Mean | 5.2% | 8.7% |
| Median | 5.1% | 8.2% |
| Interquartile 25% (IQ1) | 3.8% | 6.1% |
| Interquartile 75% (IQ3) | 6.2% | 10.0% |
| Interquartile Range (IQR) | 2.4% | 3.9% |
| Standard Deviation (Sample) | 2.0% | 3.9% |
| Standard Deviation (Population) | 2.0% | 3.8% |
Similar Demographics by 4 or more Vehicles in Household
Demographics Similar to Immigrants from Somalia by 4 or more Vehicles in Household
In terms of 4 or more vehicles in household, the demographic groups most similar to Immigrants from Somalia are Paraguayan (4.9%, a difference of 0.15%), Moroccan (4.9%, a difference of 0.38%), Houma (4.9%, a difference of 0.39%), Menominee (5.0%, a difference of 0.87%), and Immigrants from Serbia (5.0%, a difference of 1.8%).
| Demographics | Rating | Rank | 4 or more Vehicles in Household |
| Bahamians | 0.0 /100 | #302 | Tragic 5.1% |
| Immigrants | Greece | 0.0 /100 | #303 | Tragic 5.1% |
| Cypriots | 0.0 /100 | #304 | Tragic 5.0% |
| Somalis | 0.0 /100 | #305 | Tragic 5.0% |
| Immigrants | Serbia | 0.0 /100 | #306 | Tragic 5.0% |
| Menominee | 0.0 /100 | #307 | Tragic 5.0% |
| Paraguayans | 0.0 /100 | #308 | Tragic 4.9% |
| Immigrants | Somalia | 0.0 /100 | #309 | Tragic 4.9% |
| Moroccans | 0.0 /100 | #310 | Tragic 4.9% |
| Houma | 0.0 /100 | #311 | Tragic 4.9% |
| Albanians | 0.0 /100 | #312 | Tragic 4.8% |
| Immigrants | Israel | 0.0 /100 | #313 | Tragic 4.8% |
| Immigrants | West Indies | 0.0 /100 | #314 | Tragic 4.7% |
| Immigrants | Belarus | 0.0 /100 | #315 | Tragic 4.7% |
| Puerto Ricans | 0.0 /100 | #316 | Tragic 4.7% |
Demographics Similar to Yaqui by 4 or more Vehicles in Household
In terms of 4 or more vehicles in household, the demographic groups most similar to Yaqui are Marshallese (8.1%, a difference of 0.29%), Alaskan Athabascan (8.1%, a difference of 0.60%), Guamanian/Chamorro (8.1%, a difference of 0.80%), Native/Alaskan (8.2%, a difference of 0.82%), and Navajo (8.2%, a difference of 1.2%).
| Demographics | Rating | Rank | 4 or more Vehicles in Household |
| Mexican American Indians | 100.0 /100 | #26 | Exceptional 8.4% |
| Sri Lankans | 100.0 /100 | #27 | Exceptional 8.4% |
| Cheyenne | 100.0 /100 | #28 | Exceptional 8.3% |
| Immigrants | South Eastern Asia | 100.0 /100 | #29 | Exceptional 8.2% |
| Navajo | 100.0 /100 | #30 | Exceptional 8.2% |
| Natives/Alaskans | 100.0 /100 | #31 | Exceptional 8.2% |
| Marshallese | 100.0 /100 | #32 | Exceptional 8.1% |
| Yaqui | 100.0 /100 | #33 | Exceptional 8.1% |
| Alaskan Athabascans | 100.0 /100 | #34 | Exceptional 8.1% |
| Guamanians/Chamorros | 100.0 /100 | #35 | Exceptional 8.1% |
| Norwegians | 100.0 /100 | #36 | Exceptional 8.0% |
| Scandinavians | 100.0 /100 | #37 | Exceptional 8.0% |
| Sioux | 100.0 /100 | #38 | Exceptional 8.0% |
| Spanish Americans | 100.0 /100 | #39 | Exceptional 8.0% |
| Spanish | 100.0 /100 | #40 | Exceptional 7.9% |