Immigrants from Zaire vs Immigrants from Cabo Verde 4 or more Vehicles in Household
COMPARE
Immigrants from Zaire
Immigrants from Cabo Verde
4 or more Vehicles in Household
4 or more Vehicles in Household Comparison
Immigrants from Zaire
Immigrants from Cabo Verde
5.1%
4 OR MORE VEHICLES IN HOUSEHOLD
0.0/ 100
METRIC RATING
301st/ 347
METRIC RANK
3.8%
4 OR MORE VEHICLES IN HOUSEHOLD
0.0/ 100
METRIC RATING
338th/ 347
METRIC RANK
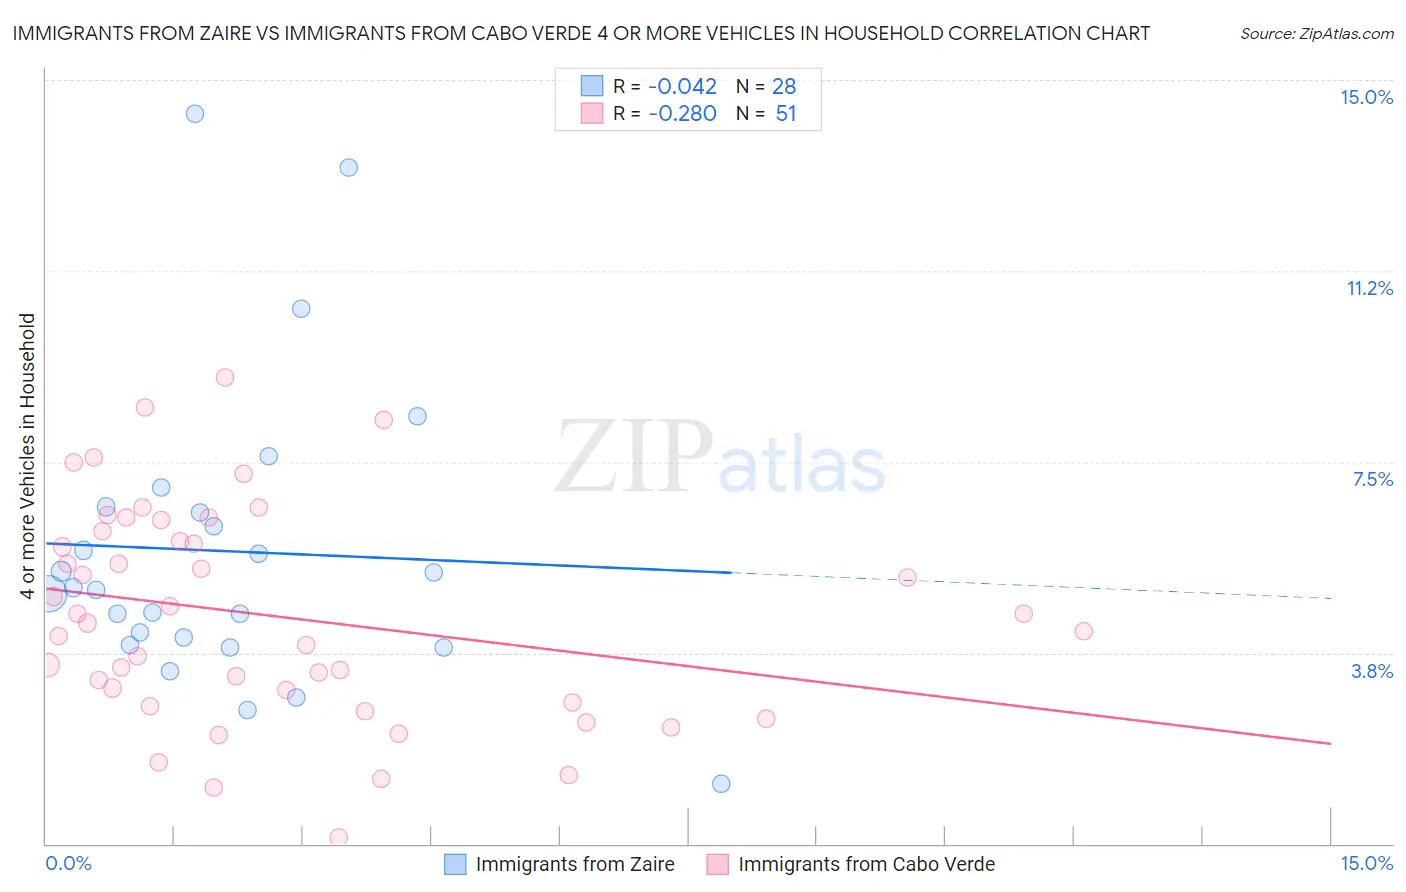
Immigrants from Zaire vs Immigrants from Cabo Verde 4 or more Vehicles in Household Correlation Chart
The statistical analysis conducted on geographies consisting of 106,897,629 people shows no correlation between the proportion of Immigrants from Zaire and percentage of households with 4 or more vehicles available in the United States with a correlation coefficient (R) of -0.042 and weighted average of 5.1%. Similarly, the statistical analysis conducted on geographies consisting of 38,088,471 people shows a weak negative correlation between the proportion of Immigrants from Cabo Verde and percentage of households with 4 or more vehicles available in the United States with a correlation coefficient (R) of -0.280 and weighted average of 3.8%, a difference of 33.7%.
4 or more Vehicles in Household Correlation Summary
| Measurement | Immigrants from Zaire | Immigrants from Cabo Verde |
| Minimum | 1.2% | 0.12% |
| Maximum | 14.3% | 9.2% |
| Range | 13.2% | 9.0% |
| Mean | 5.7% | 4.5% |
| Median | 5.0% | 4.3% |
| Interquartile 25% (IQ1) | 4.0% | 2.8% |
| Interquartile 75% (IQ3) | 6.6% | 6.1% |
| Interquartile Range (IQR) | 2.6% | 3.4% |
| Standard Deviation (Sample) | 2.9% | 2.1% |
| Standard Deviation (Population) | 2.9% | 2.1% |
Similar Demographics by 4 or more Vehicles in Household
Demographics Similar to Immigrants from Zaire by 4 or more Vehicles in Household
In terms of 4 or more vehicles in household, the demographic groups most similar to Immigrants from Zaire are Immigrants from Morocco (5.1%, a difference of 0.080%), Bahamian (5.1%, a difference of 0.31%), Immigrants from Greece (5.1%, a difference of 0.77%), Cypriot (5.0%, a difference of 1.3%), and Somali (5.0%, a difference of 1.3%).
| Demographics | Rating | Rank | 4 or more Vehicles in Household |
| Ghanaians | 0.1 /100 | #294 | Tragic 5.2% |
| Immigrants | Brazil | 0.1 /100 | #295 | Tragic 5.2% |
| Israelis | 0.1 /100 | #296 | Tragic 5.2% |
| Immigrants | Venezuela | 0.1 /100 | #297 | Tragic 5.2% |
| Immigrants | South America | 0.1 /100 | #298 | Tragic 5.2% |
| Immigrants | Ghana | 0.1 /100 | #299 | Tragic 5.2% |
| Immigrants | Morocco | 0.0 /100 | #300 | Tragic 5.1% |
| Immigrants | Zaire | 0.0 /100 | #301 | Tragic 5.1% |
| Bahamians | 0.0 /100 | #302 | Tragic 5.1% |
| Immigrants | Greece | 0.0 /100 | #303 | Tragic 5.1% |
| Cypriots | 0.0 /100 | #304 | Tragic 5.0% |
| Somalis | 0.0 /100 | #305 | Tragic 5.0% |
| Immigrants | Serbia | 0.0 /100 | #306 | Tragic 5.0% |
| Menominee | 0.0 /100 | #307 | Tragic 5.0% |
| Paraguayans | 0.0 /100 | #308 | Tragic 4.9% |
Demographics Similar to Immigrants from Cabo Verde by 4 or more Vehicles in Household
In terms of 4 or more vehicles in household, the demographic groups most similar to Immigrants from Cabo Verde are Vietnamese (3.9%, a difference of 1.8%), Immigrants from Bangladesh (3.9%, a difference of 2.4%), Barbadian (3.9%, a difference of 2.5%), Immigrants from Uzbekistan (3.6%, a difference of 5.0%), and Immigrants from Barbados (3.6%, a difference of 5.6%).
| Demographics | Rating | Rank | 4 or more Vehicles in Household |
| West Indians | 0.0 /100 | #331 | Tragic 4.2% |
| Immigrants | Dominica | 0.0 /100 | #332 | Tragic 4.2% |
| Immigrants | Albania | 0.0 /100 | #333 | Tragic 4.1% |
| Immigrants | Trinidad and Tobago | 0.0 /100 | #334 | Tragic 4.1% |
| Barbadians | 0.0 /100 | #335 | Tragic 3.9% |
| Immigrants | Bangladesh | 0.0 /100 | #336 | Tragic 3.9% |
| Vietnamese | 0.0 /100 | #337 | Tragic 3.9% |
| Immigrants | Cabo Verde | 0.0 /100 | #338 | Tragic 3.8% |
| Immigrants | Uzbekistan | 0.0 /100 | #339 | Tragic 3.6% |
| Immigrants | Barbados | 0.0 /100 | #340 | Tragic 3.6% |
| Dominicans | 0.0 /100 | #341 | Tragic 3.5% |
| Guyanese | 0.0 /100 | #342 | Tragic 3.5% |
| British West Indians | 0.0 /100 | #343 | Tragic 3.5% |
| Immigrants | Guyana | 0.0 /100 | #344 | Tragic 3.4% |
| Immigrants | Dominican Republic | 0.0 /100 | #345 | Tragic 3.3% |