Immigrants from Zaire vs Egyptian 4 or more Vehicles in Household
COMPARE
Immigrants from Zaire
Egyptian
4 or more Vehicles in Household
4 or more Vehicles in Household Comparison
Immigrants from Zaire
Egyptians
5.1%
4 OR MORE VEHICLES IN HOUSEHOLD
0.0/ 100
METRIC RATING
301st/ 347
METRIC RANK
6.1%
4 OR MORE VEHICLES IN HOUSEHOLD
21.4/ 100
METRIC RATING
201st/ 347
METRIC RANK
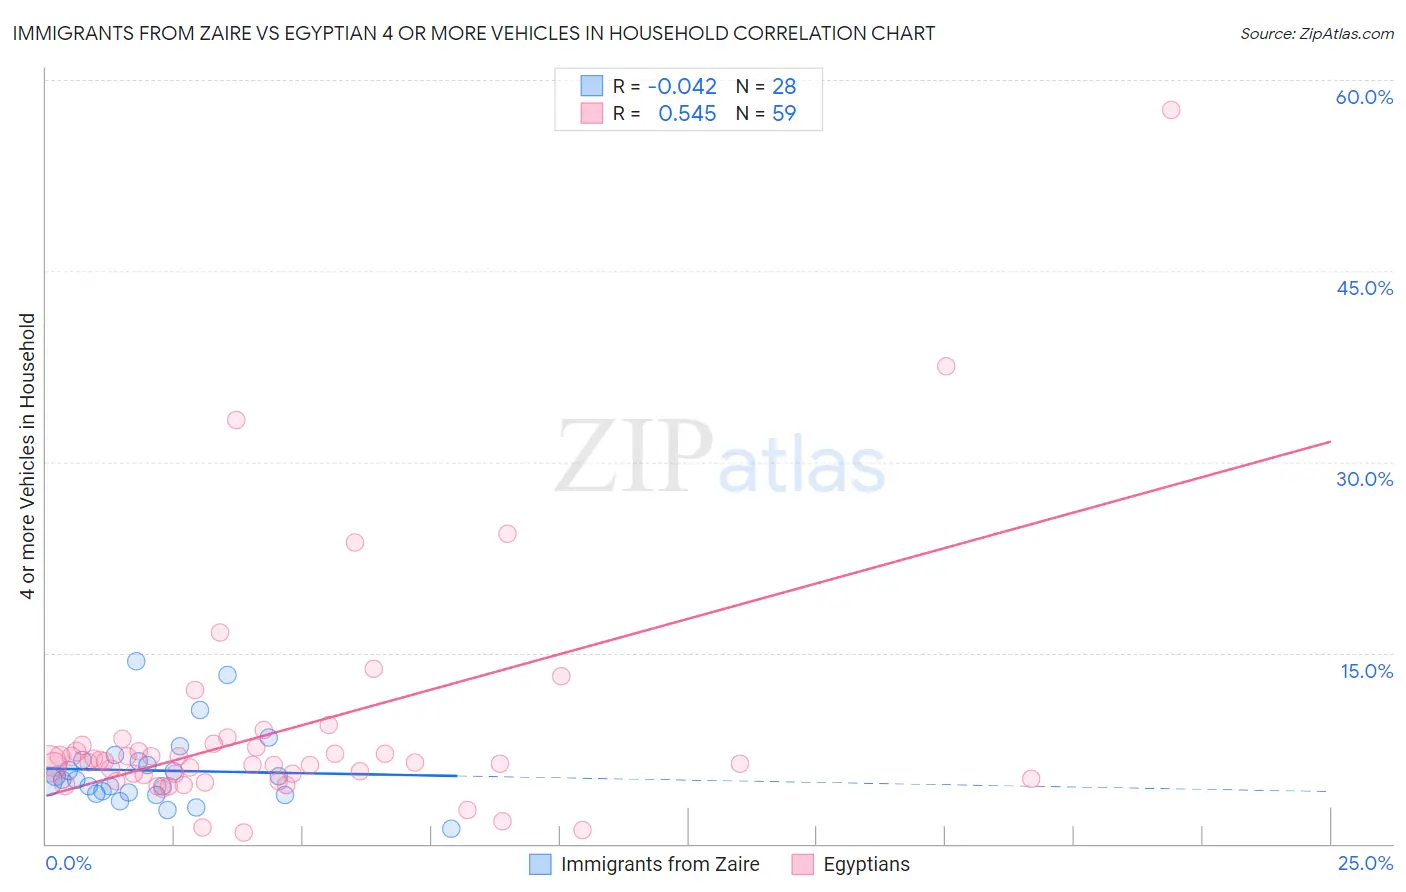
Immigrants from Zaire vs Egyptian 4 or more Vehicles in Household Correlation Chart
The statistical analysis conducted on geographies consisting of 106,897,629 people shows no correlation between the proportion of Immigrants from Zaire and percentage of households with 4 or more vehicles available in the United States with a correlation coefficient (R) of -0.042 and weighted average of 5.1%. Similarly, the statistical analysis conducted on geographies consisting of 275,639,232 people shows a substantial positive correlation between the proportion of Egyptians and percentage of households with 4 or more vehicles available in the United States with a correlation coefficient (R) of 0.545 and weighted average of 6.1%, a difference of 20.1%.
4 or more Vehicles in Household Correlation Summary
| Measurement | Immigrants from Zaire | Egyptian |
| Minimum | 1.2% | 0.85% |
| Maximum | 14.3% | 57.7% |
| Range | 13.2% | 56.8% |
| Mean | 5.7% | 8.9% |
| Median | 5.0% | 6.4% |
| Interquartile 25% (IQ1) | 4.0% | 5.1% |
| Interquartile 75% (IQ3) | 6.6% | 7.7% |
| Interquartile Range (IQR) | 2.6% | 2.6% |
| Standard Deviation (Sample) | 2.9% | 9.3% |
| Standard Deviation (Population) | 2.9% | 9.2% |
Similar Demographics by 4 or more Vehicles in Household
Demographics Similar to Immigrants from Zaire by 4 or more Vehicles in Household
In terms of 4 or more vehicles in household, the demographic groups most similar to Immigrants from Zaire are Immigrants from Morocco (5.1%, a difference of 0.080%), Bahamian (5.1%, a difference of 0.31%), Immigrants from Greece (5.1%, a difference of 0.77%), Cypriot (5.0%, a difference of 1.3%), and Somali (5.0%, a difference of 1.3%).
| Demographics | Rating | Rank | 4 or more Vehicles in Household |
| Ghanaians | 0.1 /100 | #294 | Tragic 5.2% |
| Immigrants | Brazil | 0.1 /100 | #295 | Tragic 5.2% |
| Israelis | 0.1 /100 | #296 | Tragic 5.2% |
| Immigrants | Venezuela | 0.1 /100 | #297 | Tragic 5.2% |
| Immigrants | South America | 0.1 /100 | #298 | Tragic 5.2% |
| Immigrants | Ghana | 0.1 /100 | #299 | Tragic 5.2% |
| Immigrants | Morocco | 0.0 /100 | #300 | Tragic 5.1% |
| Immigrants | Zaire | 0.0 /100 | #301 | Tragic 5.1% |
| Bahamians | 0.0 /100 | #302 | Tragic 5.1% |
| Immigrants | Greece | 0.0 /100 | #303 | Tragic 5.1% |
| Cypriots | 0.0 /100 | #304 | Tragic 5.0% |
| Somalis | 0.0 /100 | #305 | Tragic 5.0% |
| Immigrants | Serbia | 0.0 /100 | #306 | Tragic 5.0% |
| Menominee | 0.0 /100 | #307 | Tragic 5.0% |
| Paraguayans | 0.0 /100 | #308 | Tragic 4.9% |
Demographics Similar to Egyptians by 4 or more Vehicles in Household
In terms of 4 or more vehicles in household, the demographic groups most similar to Egyptians are Immigrants from South Central Asia (6.1%, a difference of 0.010%), Latvian (6.1%, a difference of 0.050%), Immigrants from Norway (6.1%, a difference of 0.060%), Immigrants from Portugal (6.1%, a difference of 0.14%), and Immigrants from Sierra Leone (6.1%, a difference of 0.15%).
| Demographics | Rating | Rank | 4 or more Vehicles in Household |
| Immigrants | Sweden | 27.0 /100 | #194 | Fair 6.2% |
| Argentineans | 27.0 /100 | #195 | Fair 6.2% |
| Tsimshian | 26.4 /100 | #196 | Fair 6.2% |
| Immigrants | Sri Lanka | 23.7 /100 | #197 | Fair 6.1% |
| Immigrants | Portugal | 22.3 /100 | #198 | Fair 6.1% |
| Immigrants | Norway | 21.8 /100 | #199 | Fair 6.1% |
| Latvians | 21.7 /100 | #200 | Fair 6.1% |
| Egyptians | 21.4 /100 | #201 | Fair 6.1% |
| Immigrants | South Central Asia | 21.3 /100 | #202 | Fair 6.1% |
| Immigrants | Sierra Leone | 20.5 /100 | #203 | Fair 6.1% |
| Immigrants | Belize | 19.8 /100 | #204 | Poor 6.1% |
| Hondurans | 19.3 /100 | #205 | Poor 6.1% |
| Kenyans | 18.5 /100 | #206 | Poor 6.1% |
| Immigrants | Chile | 16.9 /100 | #207 | Poor 6.1% |
| Immigrants | Nigeria | 15.6 /100 | #208 | Poor 6.1% |