Immigrants from Zaire vs Yaqui Single Mother Poverty
COMPARE
Immigrants from Zaire
Yaqui
Single Mother Poverty
Single Mother Poverty Comparison
Immigrants from Zaire
Yaqui
32.0%
SINGLE MOTHER POVERTY
0.0/ 100
METRIC RATING
278th/ 347
METRIC RANK
33.1%
SINGLE MOTHER POVERTY
0.0/ 100
METRIC RATING
295th/ 347
METRIC RANK
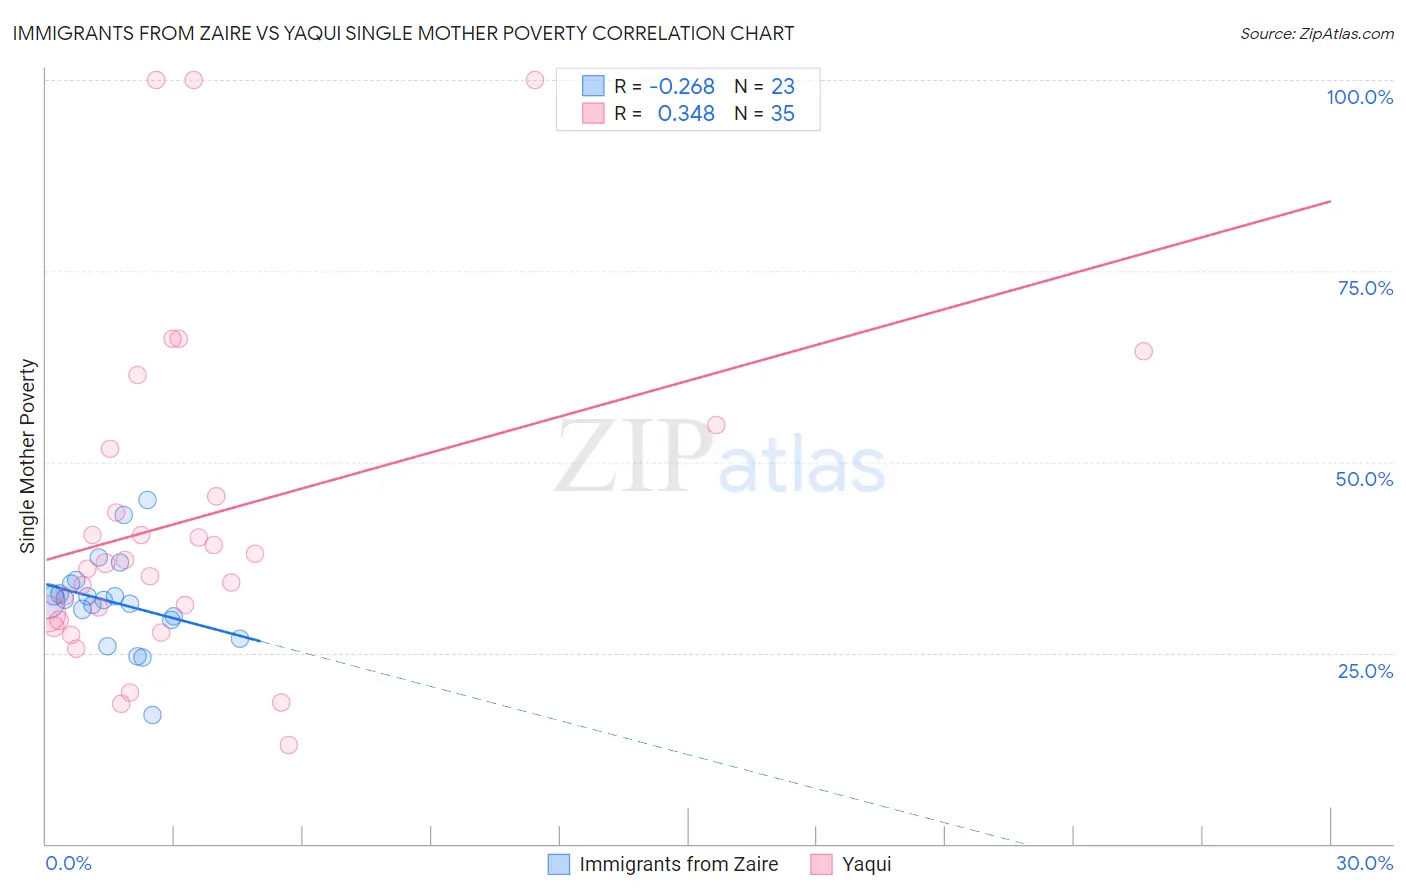
Immigrants from Zaire vs Yaqui Single Mother Poverty Correlation Chart
The statistical analysis conducted on geographies consisting of 106,703,532 people shows a weak negative correlation between the proportion of Immigrants from Zaire and poverty level among single mothers in the United States with a correlation coefficient (R) of -0.268 and weighted average of 32.0%. Similarly, the statistical analysis conducted on geographies consisting of 106,870,477 people shows a mild positive correlation between the proportion of Yaqui and poverty level among single mothers in the United States with a correlation coefficient (R) of 0.348 and weighted average of 33.1%, a difference of 3.6%.
Single Mother Poverty Correlation Summary
| Measurement | Immigrants from Zaire | Yaqui |
| Minimum | 16.9% | 12.9% |
| Maximum | 45.1% | 100.0% |
| Range | 28.2% | 87.1% |
| Mean | 31.6% | 42.8% |
| Median | 31.9% | 36.7% |
| Interquartile 25% (IQ1) | 29.4% | 29.3% |
| Interquartile 75% (IQ3) | 34.1% | 51.8% |
| Interquartile Range (IQR) | 4.7% | 22.5% |
| Standard Deviation (Sample) | 5.9% | 22.1% |
| Standard Deviation (Population) | 5.8% | 21.8% |
Demographics Similar to Immigrants from Zaire and Yaqui by Single Mother Poverty
In terms of single mother poverty, the demographic groups most similar to Immigrants from Zaire are Mexican American Indian (31.9%, a difference of 0.22%), Marshallese (32.1%, a difference of 0.40%), Delaware (31.8%, a difference of 0.43%), Nonimmigrants (32.2%, a difference of 0.62%), and Cree (32.2%, a difference of 0.64%). Similarly, the demographic groups most similar to Yaqui are French American Indian (33.1%, a difference of 0.030%), Blackfeet (33.2%, a difference of 0.16%), Aleut (32.9%, a difference of 0.66%), Shoshone (32.9%, a difference of 0.69%), and Guatemalan (32.9%, a difference of 0.72%).
| Demographics | Rating | Rank | Single Mother Poverty |
| Delaware | 0.0 /100 | #276 | Tragic 31.8% |
| Mexican American Indians | 0.0 /100 | #277 | Tragic 31.9% |
| Immigrants | Zaire | 0.0 /100 | #278 | Tragic 32.0% |
| Marshallese | 0.0 /100 | #279 | Tragic 32.1% |
| Immigrants | Nonimmigrants | 0.0 /100 | #280 | Tragic 32.2% |
| Cree | 0.0 /100 | #281 | Tragic 32.2% |
| Immigrants | Azores | 0.0 /100 | #282 | Tragic 32.2% |
| Spanish Americans | 0.0 /100 | #283 | Tragic 32.3% |
| Indonesians | 0.0 /100 | #284 | Tragic 32.4% |
| Immigrants | Latin America | 0.0 /100 | #285 | Tragic 32.4% |
| Yup'ik | 0.0 /100 | #286 | Tragic 32.5% |
| Immigrants | Dominica | 0.0 /100 | #287 | Tragic 32.5% |
| Somalis | 0.0 /100 | #288 | Tragic 32.6% |
| U.S. Virgin Islanders | 0.0 /100 | #289 | Tragic 32.6% |
| Osage | 0.0 /100 | #290 | Tragic 32.6% |
| Guatemalans | 0.0 /100 | #291 | Tragic 32.9% |
| Shoshone | 0.0 /100 | #292 | Tragic 32.9% |
| Aleuts | 0.0 /100 | #293 | Tragic 32.9% |
| French American Indians | 0.0 /100 | #294 | Tragic 33.1% |
| Yaqui | 0.0 /100 | #295 | Tragic 33.1% |
| Blackfeet | 0.0 /100 | #296 | Tragic 33.2% |