Immigrants from Zaire vs Yakama 4 or more Vehicles in Household
COMPARE
Immigrants from Zaire
Yakama
4 or more Vehicles in Household
4 or more Vehicles in Household Comparison
Immigrants from Zaire
Yakama
5.1%
4 OR MORE VEHICLES IN HOUSEHOLD
0.0/ 100
METRIC RATING
301st/ 347
METRIC RANK
12.9%
4 OR MORE VEHICLES IN HOUSEHOLD
100/ 100
METRIC RATING
1st/ 347
METRIC RANK
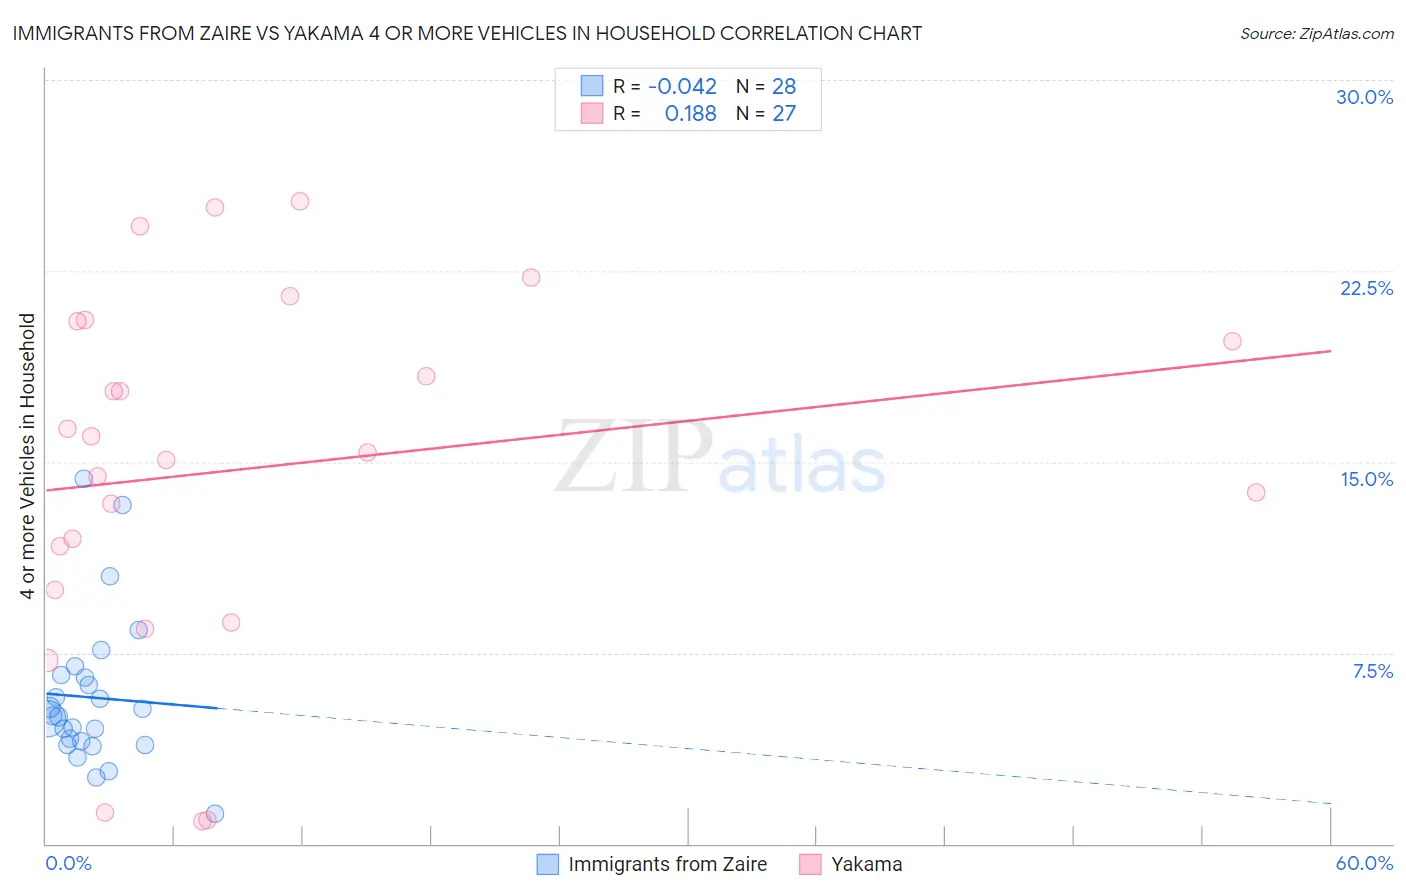
Immigrants from Zaire vs Yakama 4 or more Vehicles in Household Correlation Chart
The statistical analysis conducted on geographies consisting of 106,897,629 people shows no correlation between the proportion of Immigrants from Zaire and percentage of households with 4 or more vehicles available in the United States with a correlation coefficient (R) of -0.042 and weighted average of 5.1%. Similarly, the statistical analysis conducted on geographies consisting of 19,917,241 people shows a poor positive correlation between the proportion of Yakama and percentage of households with 4 or more vehicles available in the United States with a correlation coefficient (R) of 0.188 and weighted average of 12.9%, a difference of 154.0%.
4 or more Vehicles in Household Correlation Summary
| Measurement | Immigrants from Zaire | Yakama |
| Minimum | 1.2% | 0.86% |
| Maximum | 14.3% | 25.2% |
| Range | 13.2% | 24.4% |
| Mean | 5.7% | 14.8% |
| Median | 5.0% | 15.4% |
| Interquartile 25% (IQ1) | 4.0% | 10.0% |
| Interquartile 75% (IQ3) | 6.6% | 20.5% |
| Interquartile Range (IQR) | 2.6% | 10.5% |
| Standard Deviation (Sample) | 2.9% | 7.0% |
| Standard Deviation (Population) | 2.9% | 6.9% |
Similar Demographics by 4 or more Vehicles in Household
Demographics Similar to Immigrants from Zaire by 4 or more Vehicles in Household
In terms of 4 or more vehicles in household, the demographic groups most similar to Immigrants from Zaire are Immigrants from Morocco (5.1%, a difference of 0.080%), Bahamian (5.1%, a difference of 0.31%), Immigrants from Greece (5.1%, a difference of 0.77%), Cypriot (5.0%, a difference of 1.3%), and Somali (5.0%, a difference of 1.3%).
| Demographics | Rating | Rank | 4 or more Vehicles in Household |
| Ghanaians | 0.1 /100 | #294 | Tragic 5.2% |
| Immigrants | Brazil | 0.1 /100 | #295 | Tragic 5.2% |
| Israelis | 0.1 /100 | #296 | Tragic 5.2% |
| Immigrants | Venezuela | 0.1 /100 | #297 | Tragic 5.2% |
| Immigrants | South America | 0.1 /100 | #298 | Tragic 5.2% |
| Immigrants | Ghana | 0.1 /100 | #299 | Tragic 5.2% |
| Immigrants | Morocco | 0.0 /100 | #300 | Tragic 5.1% |
| Immigrants | Zaire | 0.0 /100 | #301 | Tragic 5.1% |
| Bahamians | 0.0 /100 | #302 | Tragic 5.1% |
| Immigrants | Greece | 0.0 /100 | #303 | Tragic 5.1% |
| Cypriots | 0.0 /100 | #304 | Tragic 5.0% |
| Somalis | 0.0 /100 | #305 | Tragic 5.0% |
| Immigrants | Serbia | 0.0 /100 | #306 | Tragic 5.0% |
| Menominee | 0.0 /100 | #307 | Tragic 5.0% |
| Paraguayans | 0.0 /100 | #308 | Tragic 4.9% |
Demographics Similar to Yakama by 4 or more Vehicles in Household
In terms of 4 or more vehicles in household, the demographic groups most similar to Yakama are Colville (11.1%, a difference of 16.1%), Spanish American Indian (10.8%, a difference of 20.1%), Tongan (10.0%, a difference of 28.9%), Immigrants from Fiji (9.6%, a difference of 34.4%), and Puget Sound Salish (9.4%, a difference of 37.8%).
| Demographics | Rating | Rank | 4 or more Vehicles in Household |
| Yakama | 100 /100 | #1 | Exceptional 12.9% |
| Colville | 100.0 /100 | #2 | Exceptional 11.1% |
| Spanish American Indians | 100.0 /100 | #3 | Exceptional 10.8% |
| Tongans | 100.0 /100 | #4 | Exceptional 10.0% |
| Immigrants | Fiji | 100.0 /100 | #5 | Exceptional 9.6% |
| Puget Sound Salish | 100.0 /100 | #6 | Exceptional 9.4% |
| Native Hawaiians | 100.0 /100 | #7 | Exceptional 9.4% |
| Arapaho | 100.0 /100 | #8 | Exceptional 9.4% |
| Samoans | 100.0 /100 | #9 | Exceptional 9.2% |
| Paiute | 100.0 /100 | #10 | Exceptional 9.0% |
| Immigrants | Mexico | 100.0 /100 | #11 | Exceptional 9.0% |
| Mexicans | 100.0 /100 | #12 | Exceptional 8.9% |
| Hawaiians | 100.0 /100 | #13 | Exceptional 8.9% |
| Chinese | 100.0 /100 | #14 | Exceptional 8.8% |
| Shoshone | 100.0 /100 | #15 | Exceptional 8.8% |