Immigrants from Syria vs Kenyan 2 or more Vehicles in Household
COMPARE
Immigrants from Syria
Kenyan
2 or more Vehicles in Household
2 or more Vehicles in Household Comparison
Immigrants from Syria
Kenyans
56.2%
2 OR MORE VEHICLES IN HOUSEHOLD
81.4/ 100
METRIC RATING
144th/ 347
METRIC RANK
55.5%
2 OR MORE VEHICLES IN HOUSEHOLD
58.1/ 100
METRIC RATING
167th/ 347
METRIC RANK
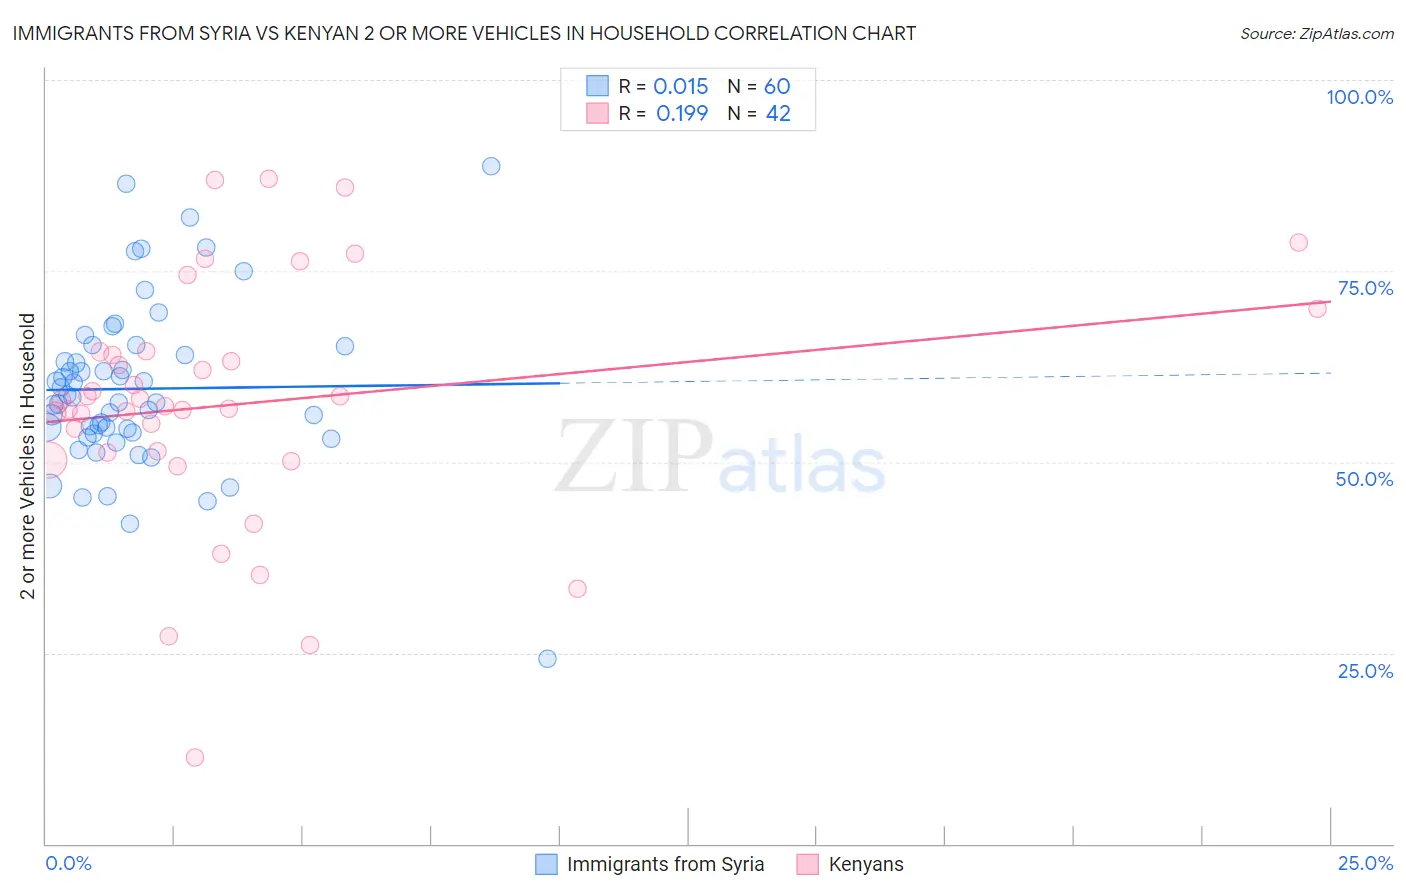
Immigrants from Syria vs Kenyan 2 or more Vehicles in Household Correlation Chart
The statistical analysis conducted on geographies consisting of 174,033,758 people shows no correlation between the proportion of Immigrants from Syria and percentage of households with 2 or more vehicles available in the United States with a correlation coefficient (R) of 0.015 and weighted average of 56.2%. Similarly, the statistical analysis conducted on geographies consisting of 168,179,955 people shows a poor positive correlation between the proportion of Kenyans and percentage of households with 2 or more vehicles available in the United States with a correlation coefficient (R) of 0.199 and weighted average of 55.5%, a difference of 1.1%.
2 or more Vehicles in Household Correlation Summary
| Measurement | Immigrants from Syria | Kenyan |
| Minimum | 24.2% | 11.3% |
| Maximum | 88.7% | 87.1% |
| Range | 64.5% | 75.8% |
| Mean | 59.6% | 57.6% |
| Median | 58.2% | 57.7% |
| Interquartile 25% (IQ1) | 53.8% | 51.2% |
| Interquartile 75% (IQ3) | 64.6% | 64.4% |
| Interquartile Range (IQR) | 10.8% | 13.2% |
| Standard Deviation (Sample) | 11.0% | 16.2% |
| Standard Deviation (Population) | 10.9% | 16.0% |
Similar Demographics by 2 or more Vehicles in Household
Demographics Similar to Immigrants from Syria by 2 or more Vehicles in Household
In terms of 2 or more vehicles in household, the demographic groups most similar to Immigrants from Syria are Syrian (56.2%, a difference of 0.010%), Seminole (56.2%, a difference of 0.020%), Venezuelan (56.1%, a difference of 0.050%), Serbian (56.1%, a difference of 0.070%), and Immigrants from Moldova (56.1%, a difference of 0.070%).
| Demographics | Rating | Rank | 2 or more Vehicles in Household |
| Cubans | 84.8 /100 | #137 | Excellent 56.3% |
| Salvadorans | 84.7 /100 | #138 | Excellent 56.3% |
| Armenians | 84.3 /100 | #139 | Excellent 56.3% |
| Latvians | 83.6 /100 | #140 | Excellent 56.2% |
| Immigrants | Cambodia | 83.6 /100 | #141 | Excellent 56.2% |
| South Africans | 83.1 /100 | #142 | Excellent 56.2% |
| Seminole | 81.7 /100 | #143 | Excellent 56.2% |
| Immigrants | Syria | 81.4 /100 | #144 | Excellent 56.2% |
| Syrians | 81.2 /100 | #145 | Excellent 56.2% |
| Venezuelans | 80.7 /100 | #146 | Excellent 56.1% |
| Serbians | 80.3 /100 | #147 | Excellent 56.1% |
| Immigrants | Moldova | 80.2 /100 | #148 | Excellent 56.1% |
| Chileans | 80.2 /100 | #149 | Excellent 56.1% |
| Nicaraguans | 79.9 /100 | #150 | Good 56.1% |
| Immigrants | Northern Europe | 78.7 /100 | #151 | Good 56.1% |
Demographics Similar to Kenyans by 2 or more Vehicles in Household
In terms of 2 or more vehicles in household, the demographic groups most similar to Kenyans are Immigrants from Sri Lanka (55.5%, a difference of 0.010%), Immigrants from El Salvador (55.6%, a difference of 0.050%), French American Indian (55.5%, a difference of 0.060%), Dutch West Indian (55.6%, a difference of 0.070%), and Immigrants from Austria (55.5%, a difference of 0.070%).
| Demographics | Rating | Rank | 2 or more Vehicles in Household |
| Crow | 67.0 /100 | #160 | Good 55.7% |
| Colville | 61.1 /100 | #161 | Good 55.6% |
| German Russians | 60.9 /100 | #162 | Good 55.6% |
| Immigrants | Zimbabwe | 60.2 /100 | #163 | Good 55.6% |
| Dutch West Indians | 59.8 /100 | #164 | Average 55.6% |
| Immigrants | El Salvador | 59.4 /100 | #165 | Average 55.6% |
| Immigrants | Sri Lanka | 58.3 /100 | #166 | Average 55.5% |
| Kenyans | 58.1 /100 | #167 | Average 55.5% |
| French American Indians | 56.7 /100 | #168 | Average 55.5% |
| Immigrants | Austria | 56.3 /100 | #169 | Average 55.5% |
| Romanians | 55.8 /100 | #170 | Average 55.5% |
| Immigrants | Costa Rica | 54.4 /100 | #171 | Average 55.4% |
| Immigrants | Nicaragua | 51.6 /100 | #172 | Average 55.4% |
| Immigrants | Western Europe | 51.4 /100 | #173 | Average 55.4% |
| Navajo | 50.0 /100 | #174 | Average 55.3% |