Immigrants from Caribbean vs Kenyan 2 or more Vehicles in Household
COMPARE
Immigrants from Caribbean
Kenyan
2 or more Vehicles in Household
2 or more Vehicles in Household Comparison
Immigrants from Caribbean
Kenyans
44.2%
2 OR MORE VEHICLES IN HOUSEHOLD
0.0/ 100
METRIC RATING
323rd/ 347
METRIC RANK
55.5%
2 OR MORE VEHICLES IN HOUSEHOLD
58.1/ 100
METRIC RATING
167th/ 347
METRIC RANK
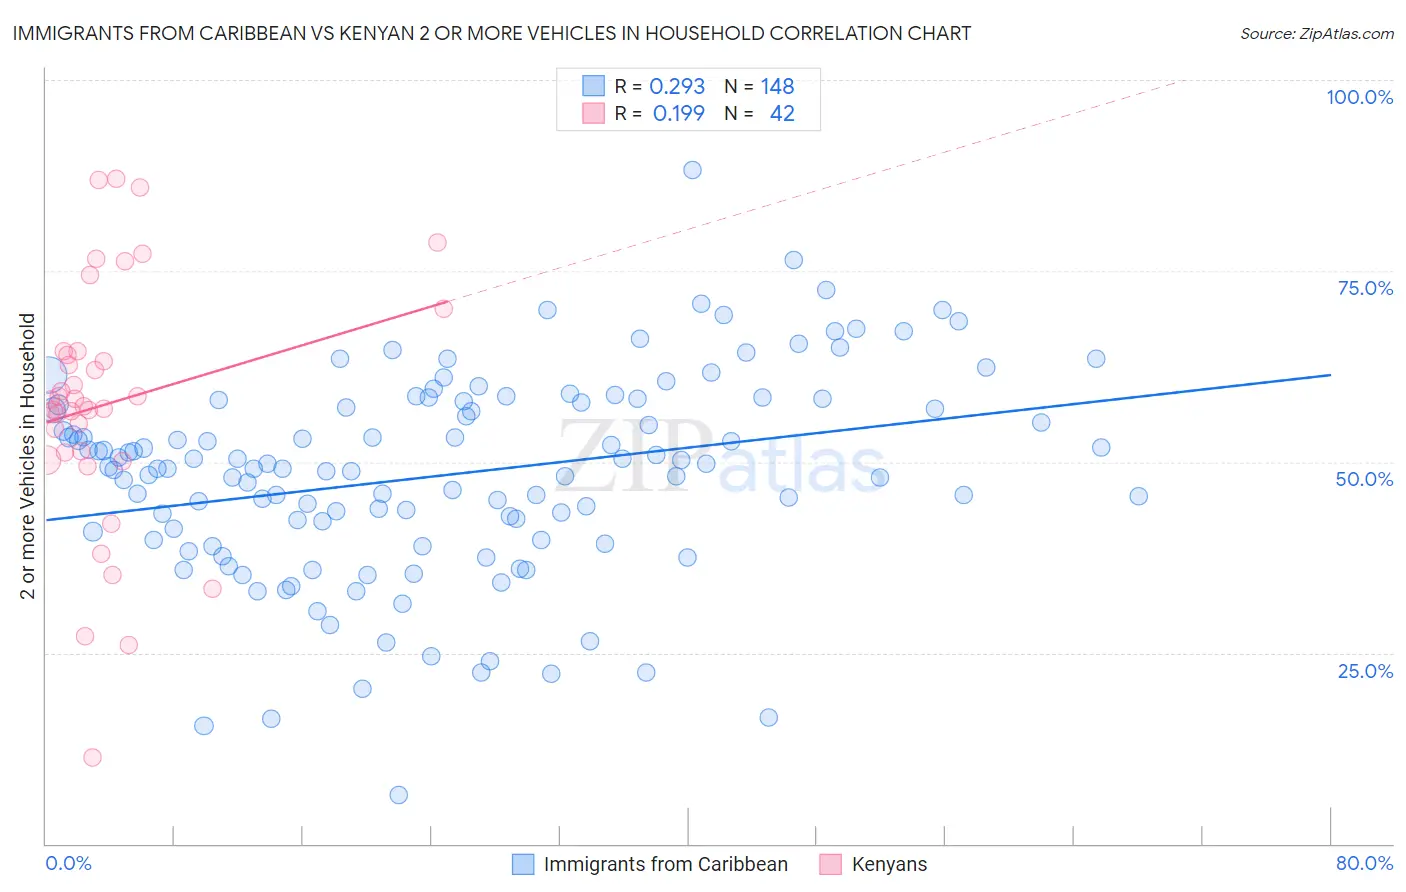
Immigrants from Caribbean vs Kenyan 2 or more Vehicles in Household Correlation Chart
The statistical analysis conducted on geographies consisting of 449,714,597 people shows a weak positive correlation between the proportion of Immigrants from Caribbean and percentage of households with 2 or more vehicles available in the United States with a correlation coefficient (R) of 0.293 and weighted average of 44.2%. Similarly, the statistical analysis conducted on geographies consisting of 168,179,955 people shows a poor positive correlation between the proportion of Kenyans and percentage of households with 2 or more vehicles available in the United States with a correlation coefficient (R) of 0.199 and weighted average of 55.5%, a difference of 25.6%.
2 or more Vehicles in Household Correlation Summary
| Measurement | Immigrants from Caribbean | Kenyan |
| Minimum | 6.4% | 11.3% |
| Maximum | 88.2% | 87.1% |
| Range | 81.8% | 75.8% |
| Mean | 48.3% | 57.6% |
| Median | 49.1% | 57.7% |
| Interquartile 25% (IQ1) | 40.3% | 51.2% |
| Interquartile 75% (IQ3) | 57.6% | 64.4% |
| Interquartile Range (IQR) | 17.3% | 13.2% |
| Standard Deviation (Sample) | 13.3% | 16.2% |
| Standard Deviation (Population) | 13.3% | 16.0% |
Similar Demographics by 2 or more Vehicles in Household
Demographics Similar to Immigrants from Caribbean by 2 or more Vehicles in Household
In terms of 2 or more vehicles in household, the demographic groups most similar to Immigrants from Caribbean are Senegalese (44.2%, a difference of 0.020%), Immigrants from Jamaica (44.5%, a difference of 0.57%), Immigrants from Cabo Verde (43.3%, a difference of 2.1%), Immigrants from West Indies (43.1%, a difference of 2.6%), and Immigrants from Senegal (43.0%, a difference of 2.8%).
| Demographics | Rating | Rank | 2 or more Vehicles in Household |
| Cape Verdeans | 0.0 /100 | #316 | Tragic 46.8% |
| Immigrants | Haiti | 0.0 /100 | #317 | Tragic 46.5% |
| Immigrants | Albania | 0.0 /100 | #318 | Tragic 46.0% |
| Jamaicans | 0.0 /100 | #319 | Tragic 45.8% |
| Soviet Union | 0.0 /100 | #320 | Tragic 45.7% |
| Immigrants | Jamaica | 0.0 /100 | #321 | Tragic 44.5% |
| Senegalese | 0.0 /100 | #322 | Tragic 44.2% |
| Immigrants | Caribbean | 0.0 /100 | #323 | Tragic 44.2% |
| Immigrants | Cabo Verde | 0.0 /100 | #324 | Tragic 43.3% |
| Immigrants | West Indies | 0.0 /100 | #325 | Tragic 43.1% |
| Immigrants | Senegal | 0.0 /100 | #326 | Tragic 43.0% |
| Immigrants | Yemen | 0.0 /100 | #327 | Tragic 42.8% |
| Inupiat | 0.0 /100 | #328 | Tragic 42.6% |
| Ecuadorians | 0.0 /100 | #329 | Tragic 42.0% |
| Immigrants | Dominica | 0.0 /100 | #330 | Tragic 41.6% |
Demographics Similar to Kenyans by 2 or more Vehicles in Household
In terms of 2 or more vehicles in household, the demographic groups most similar to Kenyans are Immigrants from Sri Lanka (55.5%, a difference of 0.010%), Immigrants from El Salvador (55.6%, a difference of 0.050%), French American Indian (55.5%, a difference of 0.060%), Dutch West Indian (55.6%, a difference of 0.070%), and Immigrants from Austria (55.5%, a difference of 0.070%).
| Demographics | Rating | Rank | 2 or more Vehicles in Household |
| Crow | 67.0 /100 | #160 | Good 55.7% |
| Colville | 61.1 /100 | #161 | Good 55.6% |
| German Russians | 60.9 /100 | #162 | Good 55.6% |
| Immigrants | Zimbabwe | 60.2 /100 | #163 | Good 55.6% |
| Dutch West Indians | 59.8 /100 | #164 | Average 55.6% |
| Immigrants | El Salvador | 59.4 /100 | #165 | Average 55.6% |
| Immigrants | Sri Lanka | 58.3 /100 | #166 | Average 55.5% |
| Kenyans | 58.1 /100 | #167 | Average 55.5% |
| French American Indians | 56.7 /100 | #168 | Average 55.5% |
| Immigrants | Austria | 56.3 /100 | #169 | Average 55.5% |
| Romanians | 55.8 /100 | #170 | Average 55.5% |
| Immigrants | Costa Rica | 54.4 /100 | #171 | Average 55.4% |
| Immigrants | Nicaragua | 51.6 /100 | #172 | Average 55.4% |
| Immigrants | Western Europe | 51.4 /100 | #173 | Average 55.4% |
| Navajo | 50.0 /100 | #174 | Average 55.3% |