Afghan vs Kenyan 2 or more Vehicles in Household
COMPARE
Afghan
Kenyan
2 or more Vehicles in Household
2 or more Vehicles in Household Comparison
Afghans
Kenyans
59.0%
2 OR MORE VEHICLES IN HOUSEHOLD
99.9/ 100
METRIC RATING
57th/ 347
METRIC RANK
55.5%
2 OR MORE VEHICLES IN HOUSEHOLD
58.1/ 100
METRIC RATING
167th/ 347
METRIC RANK
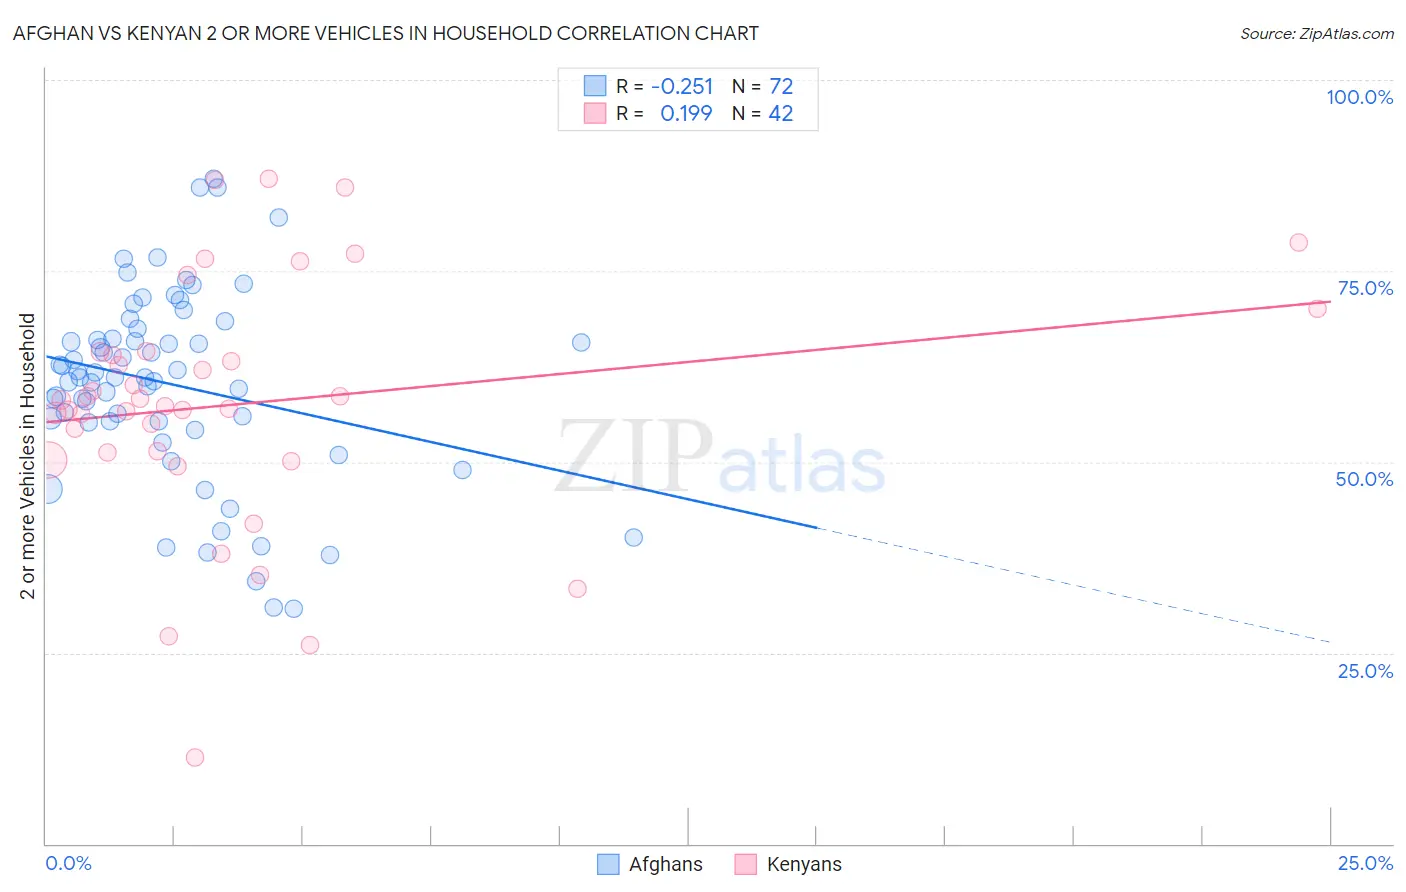
Afghan vs Kenyan 2 or more Vehicles in Household Correlation Chart
The statistical analysis conducted on geographies consisting of 148,831,306 people shows a weak negative correlation between the proportion of Afghans and percentage of households with 2 or more vehicles available in the United States with a correlation coefficient (R) of -0.251 and weighted average of 59.0%. Similarly, the statistical analysis conducted on geographies consisting of 168,179,955 people shows a poor positive correlation between the proportion of Kenyans and percentage of households with 2 or more vehicles available in the United States with a correlation coefficient (R) of 0.199 and weighted average of 55.5%, a difference of 6.2%.
2 or more Vehicles in Household Correlation Summary
| Measurement | Afghan | Kenyan |
| Minimum | 30.8% | 11.3% |
| Maximum | 87.1% | 87.1% |
| Range | 56.3% | 75.8% |
| Mean | 60.2% | 57.6% |
| Median | 61.1% | 57.7% |
| Interquartile 25% (IQ1) | 55.3% | 51.2% |
| Interquartile 75% (IQ3) | 66.8% | 64.4% |
| Interquartile Range (IQR) | 11.5% | 13.2% |
| Standard Deviation (Sample) | 12.6% | 16.2% |
| Standard Deviation (Population) | 12.5% | 16.0% |
Similar Demographics by 2 or more Vehicles in Household
Demographics Similar to Afghans by 2 or more Vehicles in Household
In terms of 2 or more vehicles in household, the demographic groups most similar to Afghans are Chickasaw (59.0%, a difference of 0.0%), Luxembourger (59.1%, a difference of 0.11%), Bhutanese (59.1%, a difference of 0.14%), Immigrants from Scotland (58.9%, a difference of 0.18%), and Spanish American (58.9%, a difference of 0.21%).
| Demographics | Rating | Rank | 2 or more Vehicles in Household |
| Choctaw | 99.9 /100 | #50 | Exceptional 59.3% |
| Spaniards | 99.9 /100 | #51 | Exceptional 59.2% |
| Immigrants | Laos | 99.9 /100 | #52 | Exceptional 59.2% |
| Celtics | 99.9 /100 | #53 | Exceptional 59.2% |
| Bhutanese | 99.9 /100 | #54 | Exceptional 59.1% |
| Luxembourgers | 99.9 /100 | #55 | Exceptional 59.1% |
| Chickasaw | 99.9 /100 | #56 | Exceptional 59.0% |
| Afghans | 99.9 /100 | #57 | Exceptional 59.0% |
| Immigrants | Scotland | 99.8 /100 | #58 | Exceptional 58.9% |
| Spanish Americans | 99.8 /100 | #59 | Exceptional 58.9% |
| French Canadians | 99.8 /100 | #60 | Exceptional 58.9% |
| Osage | 99.8 /100 | #61 | Exceptional 58.8% |
| Immigrants | Nonimmigrants | 99.8 /100 | #62 | Exceptional 58.8% |
| Mexican American Indians | 99.8 /100 | #63 | Exceptional 58.7% |
| Portuguese | 99.7 /100 | #64 | Exceptional 58.6% |
Demographics Similar to Kenyans by 2 or more Vehicles in Household
In terms of 2 or more vehicles in household, the demographic groups most similar to Kenyans are Immigrants from Sri Lanka (55.5%, a difference of 0.010%), Immigrants from El Salvador (55.6%, a difference of 0.050%), French American Indian (55.5%, a difference of 0.060%), Dutch West Indian (55.6%, a difference of 0.070%), and Immigrants from Austria (55.5%, a difference of 0.070%).
| Demographics | Rating | Rank | 2 or more Vehicles in Household |
| Crow | 67.0 /100 | #160 | Good 55.7% |
| Colville | 61.1 /100 | #161 | Good 55.6% |
| German Russians | 60.9 /100 | #162 | Good 55.6% |
| Immigrants | Zimbabwe | 60.2 /100 | #163 | Good 55.6% |
| Dutch West Indians | 59.8 /100 | #164 | Average 55.6% |
| Immigrants | El Salvador | 59.4 /100 | #165 | Average 55.6% |
| Immigrants | Sri Lanka | 58.3 /100 | #166 | Average 55.5% |
| Kenyans | 58.1 /100 | #167 | Average 55.5% |
| French American Indians | 56.7 /100 | #168 | Average 55.5% |
| Immigrants | Austria | 56.3 /100 | #169 | Average 55.5% |
| Romanians | 55.8 /100 | #170 | Average 55.5% |
| Immigrants | Costa Rica | 54.4 /100 | #171 | Average 55.4% |
| Immigrants | Nicaragua | 51.6 /100 | #172 | Average 55.4% |
| Immigrants | Western Europe | 51.4 /100 | #173 | Average 55.4% |
| Navajo | 50.0 /100 | #174 | Average 55.3% |