Immigrants from Syria vs Immigrants from Sweden 2 or more Vehicles in Household
COMPARE
Immigrants from Syria
Immigrants from Sweden
2 or more Vehicles in Household
2 or more Vehicles in Household Comparison
Immigrants from Syria
Immigrants from Sweden
56.2%
2 OR MORE VEHICLES IN HOUSEHOLD
81.4/ 100
METRIC RATING
144th/ 347
METRIC RANK
55.2%
2 OR MORE VEHICLES IN HOUSEHOLD
45.3/ 100
METRIC RATING
178th/ 347
METRIC RANK
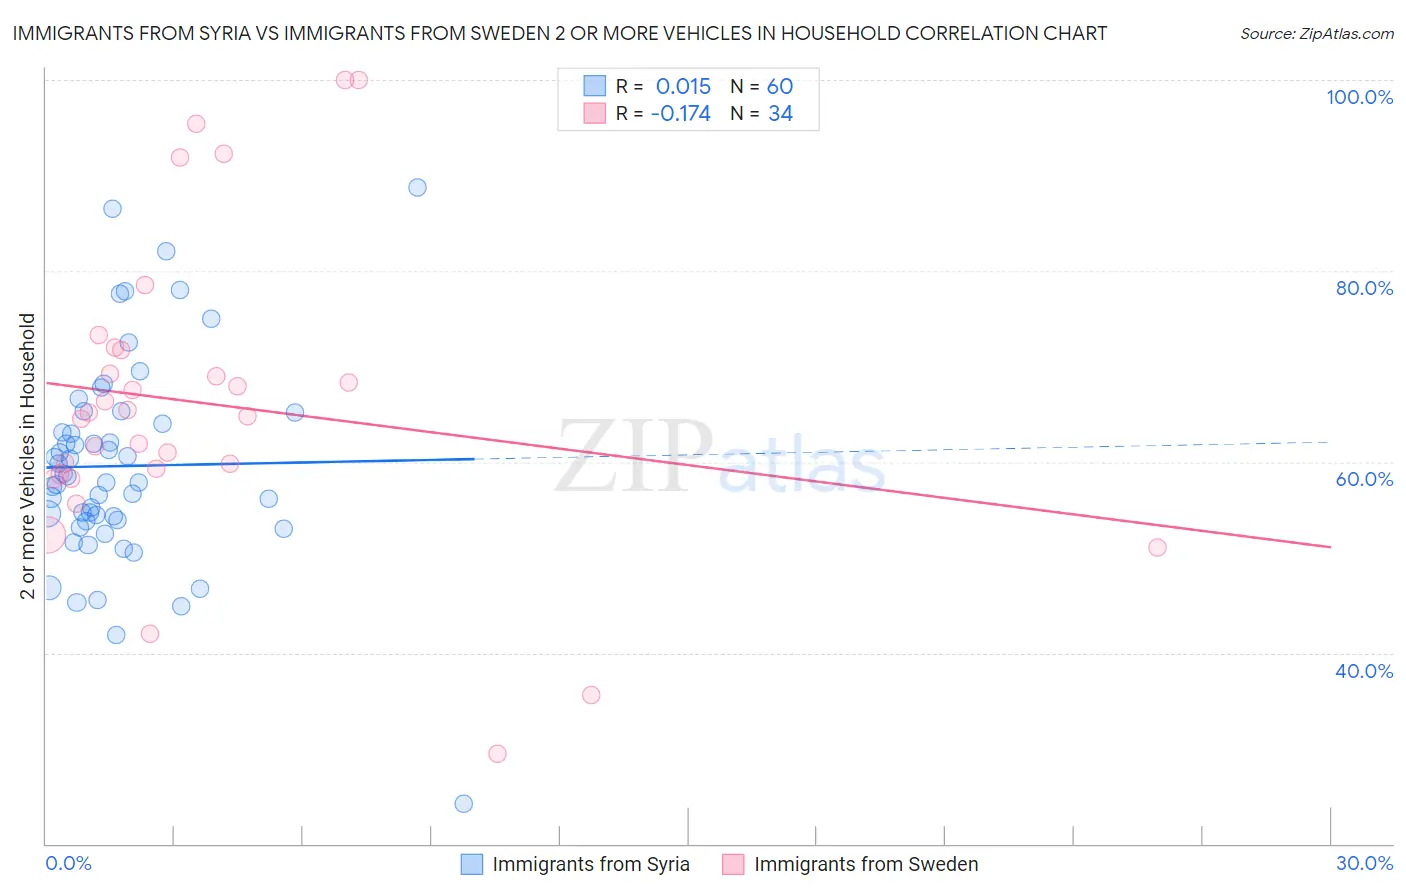
Immigrants from Syria vs Immigrants from Sweden 2 or more Vehicles in Household Correlation Chart
The statistical analysis conducted on geographies consisting of 174,033,758 people shows no correlation between the proportion of Immigrants from Syria and percentage of households with 2 or more vehicles available in the United States with a correlation coefficient (R) of 0.015 and weighted average of 56.2%. Similarly, the statistical analysis conducted on geographies consisting of 164,706,538 people shows a poor negative correlation between the proportion of Immigrants from Sweden and percentage of households with 2 or more vehicles available in the United States with a correlation coefficient (R) of -0.174 and weighted average of 55.2%, a difference of 1.7%.
2 or more Vehicles in Household Correlation Summary
| Measurement | Immigrants from Syria | Immigrants from Sweden |
| Minimum | 24.2% | 29.4% |
| Maximum | 88.7% | 100.0% |
| Range | 64.5% | 70.6% |
| Mean | 59.6% | 66.1% |
| Median | 58.2% | 65.0% |
| Interquartile 25% (IQ1) | 53.8% | 58.7% |
| Interquartile 75% (IQ3) | 64.6% | 71.7% |
| Interquartile Range (IQR) | 10.8% | 13.0% |
| Standard Deviation (Sample) | 11.0% | 16.1% |
| Standard Deviation (Population) | 10.9% | 15.9% |
Similar Demographics by 2 or more Vehicles in Household
Demographics Similar to Immigrants from Syria by 2 or more Vehicles in Household
In terms of 2 or more vehicles in household, the demographic groups most similar to Immigrants from Syria are Syrian (56.2%, a difference of 0.010%), Seminole (56.2%, a difference of 0.020%), Venezuelan (56.1%, a difference of 0.050%), Serbian (56.1%, a difference of 0.070%), and Immigrants from Moldova (56.1%, a difference of 0.070%).
| Demographics | Rating | Rank | 2 or more Vehicles in Household |
| Cubans | 84.8 /100 | #137 | Excellent 56.3% |
| Salvadorans | 84.7 /100 | #138 | Excellent 56.3% |
| Armenians | 84.3 /100 | #139 | Excellent 56.3% |
| Latvians | 83.6 /100 | #140 | Excellent 56.2% |
| Immigrants | Cambodia | 83.6 /100 | #141 | Excellent 56.2% |
| South Africans | 83.1 /100 | #142 | Excellent 56.2% |
| Seminole | 81.7 /100 | #143 | Excellent 56.2% |
| Immigrants | Syria | 81.4 /100 | #144 | Excellent 56.2% |
| Syrians | 81.2 /100 | #145 | Excellent 56.2% |
| Venezuelans | 80.7 /100 | #146 | Excellent 56.1% |
| Serbians | 80.3 /100 | #147 | Excellent 56.1% |
| Immigrants | Moldova | 80.2 /100 | #148 | Excellent 56.1% |
| Chileans | 80.2 /100 | #149 | Excellent 56.1% |
| Nicaraguans | 79.9 /100 | #150 | Good 56.1% |
| Immigrants | Northern Europe | 78.7 /100 | #151 | Good 56.1% |
Demographics Similar to Immigrants from Sweden by 2 or more Vehicles in Household
In terms of 2 or more vehicles in household, the demographic groups most similar to Immigrants from Sweden are Menominee (55.3%, a difference of 0.040%), Immigrants from Cuba (55.3%, a difference of 0.070%), Alaskan Athabascan (55.2%, a difference of 0.10%), Immigrants from Denmark (55.3%, a difference of 0.17%), and Navajo (55.3%, a difference of 0.19%).
| Demographics | Rating | Rank | 2 or more Vehicles in Household |
| Immigrants | Costa Rica | 54.4 /100 | #171 | Average 55.4% |
| Immigrants | Nicaragua | 51.6 /100 | #172 | Average 55.4% |
| Immigrants | Western Europe | 51.4 /100 | #173 | Average 55.4% |
| Navajo | 50.0 /100 | #174 | Average 55.3% |
| Immigrants | Denmark | 49.4 /100 | #175 | Average 55.3% |
| Immigrants | Cuba | 47.0 /100 | #176 | Average 55.3% |
| Menominee | 46.2 /100 | #177 | Average 55.3% |
| Immigrants | Sweden | 45.3 /100 | #178 | Average 55.2% |
| Alaskan Athabascans | 42.9 /100 | #179 | Average 55.2% |
| Immigrants | Kenya | 40.4 /100 | #180 | Average 55.1% |
| Immigrants | Micronesia | 38.2 /100 | #181 | Fair 55.1% |
| Cree | 38.2 /100 | #182 | Fair 55.1% |
| Immigrants | Cameroon | 37.3 /100 | #183 | Fair 55.1% |
| Apache | 36.7 /100 | #184 | Fair 55.1% |
| Arabs | 35.9 /100 | #185 | Fair 55.0% |