Immigrants from Syria vs Ute 2 or more Vehicles in Household
COMPARE
Immigrants from Syria
Ute
2 or more Vehicles in Household
2 or more Vehicles in Household Comparison
Immigrants from Syria
Ute
56.2%
2 OR MORE VEHICLES IN HOUSEHOLD
81.4/ 100
METRIC RATING
144th/ 347
METRIC RANK
56.6%
2 OR MORE VEHICLES IN HOUSEHOLD
90.4/ 100
METRIC RATING
129th/ 347
METRIC RANK
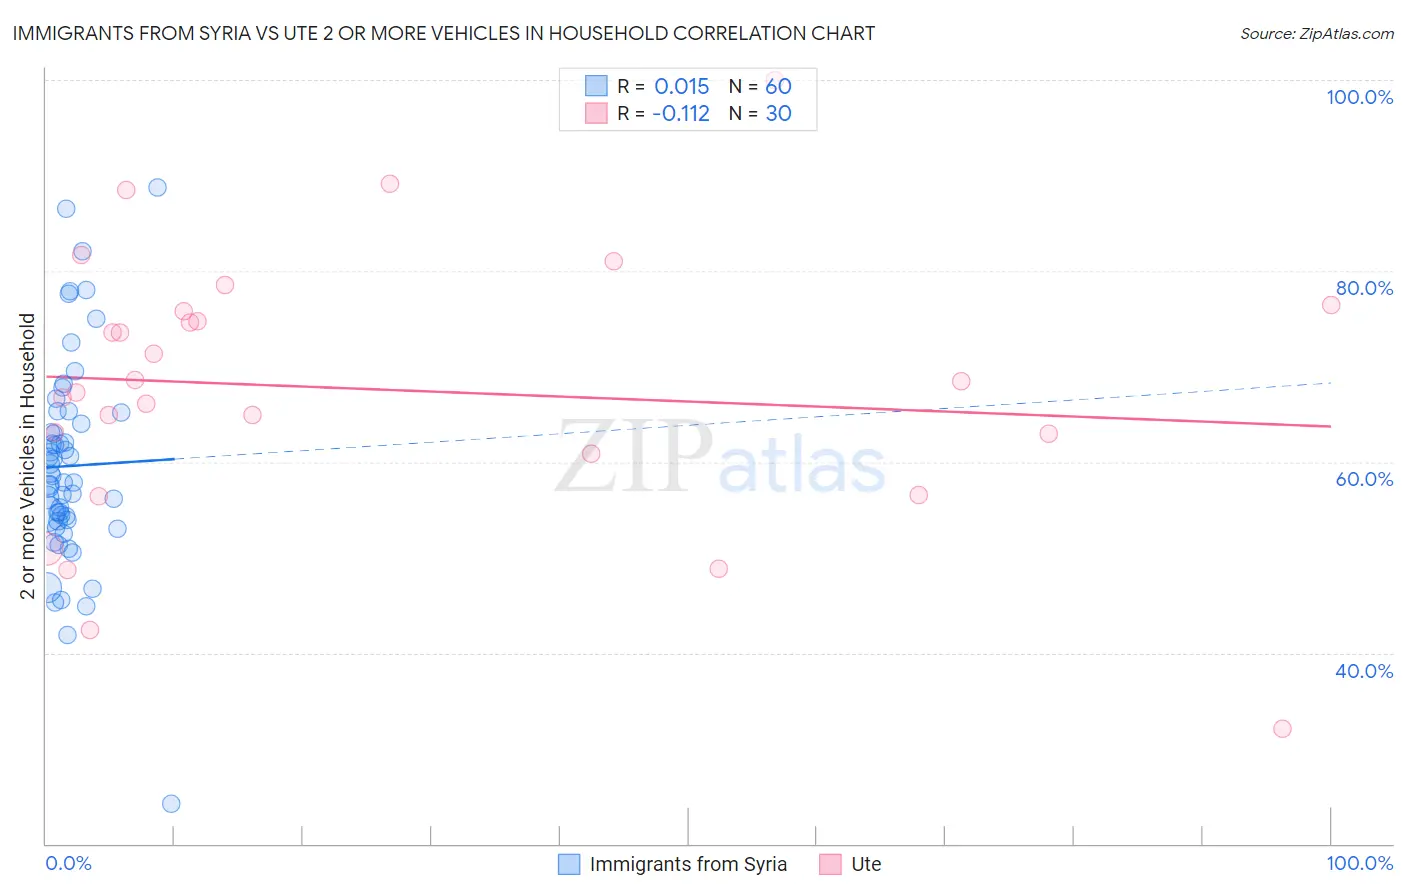
Immigrants from Syria vs Ute 2 or more Vehicles in Household Correlation Chart
The statistical analysis conducted on geographies consisting of 174,033,758 people shows no correlation between the proportion of Immigrants from Syria and percentage of households with 2 or more vehicles available in the United States with a correlation coefficient (R) of 0.015 and weighted average of 56.2%. Similarly, the statistical analysis conducted on geographies consisting of 55,668,301 people shows a poor negative correlation between the proportion of Ute and percentage of households with 2 or more vehicles available in the United States with a correlation coefficient (R) of -0.112 and weighted average of 56.6%, a difference of 0.75%.
2 or more Vehicles in Household Correlation Summary
| Measurement | Immigrants from Syria | Ute |
| Minimum | 24.2% | 32.0% |
| Maximum | 88.7% | 100.0% |
| Range | 64.5% | 68.0% |
| Mean | 59.6% | 67.6% |
| Median | 58.2% | 67.9% |
| Interquartile 25% (IQ1) | 53.8% | 60.8% |
| Interquartile 75% (IQ3) | 64.6% | 75.7% |
| Interquartile Range (IQR) | 10.8% | 14.9% |
| Standard Deviation (Sample) | 11.0% | 14.4% |
| Standard Deviation (Population) | 10.9% | 14.2% |
Demographics Similar to Immigrants from Syria and Ute by 2 or more Vehicles in Household
In terms of 2 or more vehicles in household, the demographic groups most similar to Immigrants from Syria are Syrian (56.2%, a difference of 0.010%), Seminole (56.2%, a difference of 0.020%), Venezuelan (56.1%, a difference of 0.050%), South African (56.2%, a difference of 0.11%), and Latvian (56.2%, a difference of 0.15%). Similarly, the demographic groups most similar to Ute are Immigrants from South Central Asia (56.6%, a difference of 0.020%), Immigrants from Thailand (56.6%, a difference of 0.030%), Yugoslavian (56.6%, a difference of 0.040%), Estonian (56.6%, a difference of 0.070%), and Bulgarian (56.5%, a difference of 0.070%).
| Demographics | Rating | Rank | 2 or more Vehicles in Household |
| Estonians | 90.9 /100 | #126 | Exceptional 56.6% |
| Immigrants | Thailand | 90.7 /100 | #127 | Exceptional 56.6% |
| Immigrants | South Central Asia | 90.5 /100 | #128 | Exceptional 56.6% |
| Ute | 90.4 /100 | #129 | Exceptional 56.6% |
| Yugoslavians | 90.0 /100 | #130 | Exceptional 56.6% |
| Bulgarians | 89.7 /100 | #131 | Excellent 56.5% |
| Hungarians | 89.1 /100 | #132 | Excellent 56.5% |
| Comanche | 88.4 /100 | #133 | Excellent 56.5% |
| Immigrants | Azores | 86.6 /100 | #134 | Excellent 56.4% |
| Blackfeet | 86.5 /100 | #135 | Excellent 56.4% |
| Immigrants | Asia | 86.0 /100 | #136 | Excellent 56.3% |
| Cubans | 84.8 /100 | #137 | Excellent 56.3% |
| Salvadorans | 84.7 /100 | #138 | Excellent 56.3% |
| Armenians | 84.3 /100 | #139 | Excellent 56.3% |
| Latvians | 83.6 /100 | #140 | Excellent 56.2% |
| Immigrants | Cambodia | 83.6 /100 | #141 | Excellent 56.2% |
| South Africans | 83.1 /100 | #142 | Excellent 56.2% |
| Seminole | 81.7 /100 | #143 | Excellent 56.2% |
| Immigrants | Syria | 81.4 /100 | #144 | Excellent 56.2% |
| Syrians | 81.2 /100 | #145 | Excellent 56.2% |
| Venezuelans | 80.7 /100 | #146 | Excellent 56.1% |