Immigrants from Syria vs Immigrants from Croatia 2 or more Vehicles in Household
COMPARE
Immigrants from Syria
Immigrants from Croatia
2 or more Vehicles in Household
2 or more Vehicles in Household Comparison
Immigrants from Syria
Immigrants from Croatia
56.2%
2 OR MORE VEHICLES IN HOUSEHOLD
81.4/ 100
METRIC RATING
144th/ 347
METRIC RANK
51.8%
2 OR MORE VEHICLES IN HOUSEHOLD
0.2/ 100
METRIC RATING
276th/ 347
METRIC RANK
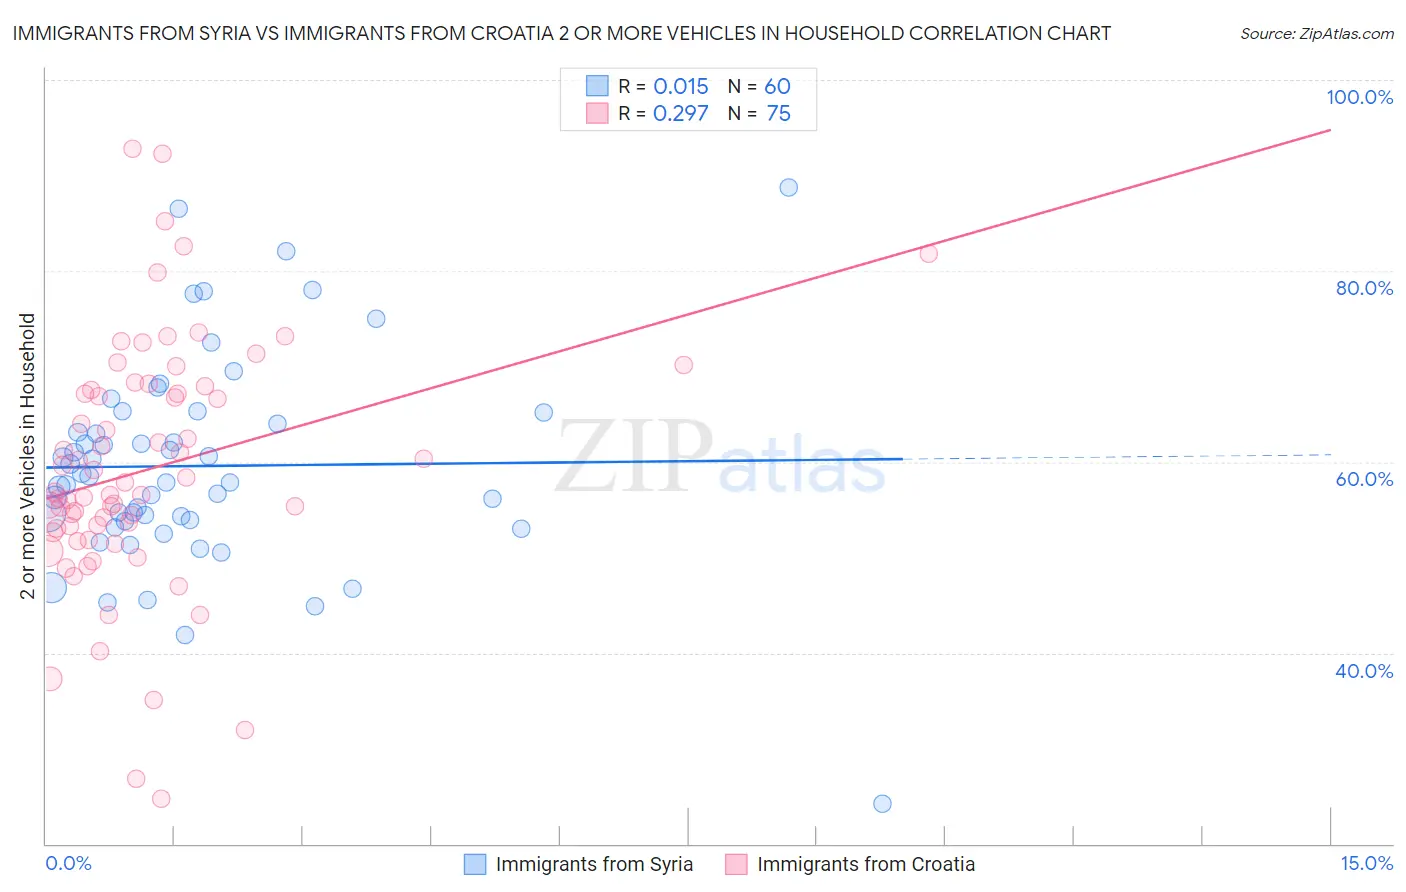
Immigrants from Syria vs Immigrants from Croatia 2 or more Vehicles in Household Correlation Chart
The statistical analysis conducted on geographies consisting of 174,033,758 people shows no correlation between the proportion of Immigrants from Syria and percentage of households with 2 or more vehicles available in the United States with a correlation coefficient (R) of 0.015 and weighted average of 56.2%. Similarly, the statistical analysis conducted on geographies consisting of 132,533,947 people shows a weak positive correlation between the proportion of Immigrants from Croatia and percentage of households with 2 or more vehicles available in the United States with a correlation coefficient (R) of 0.297 and weighted average of 51.8%, a difference of 8.4%.
2 or more Vehicles in Household Correlation Summary
| Measurement | Immigrants from Syria | Immigrants from Croatia |
| Minimum | 24.2% | 24.7% |
| Maximum | 88.7% | 92.9% |
| Range | 64.5% | 68.1% |
| Mean | 59.6% | 59.2% |
| Median | 58.2% | 56.8% |
| Interquartile 25% (IQ1) | 53.8% | 52.6% |
| Interquartile 75% (IQ3) | 64.6% | 67.5% |
| Interquartile Range (IQR) | 10.8% | 14.8% |
| Standard Deviation (Sample) | 11.0% | 13.1% |
| Standard Deviation (Population) | 10.9% | 13.0% |
Similar Demographics by 2 or more Vehicles in Household
Demographics Similar to Immigrants from Syria by 2 or more Vehicles in Household
In terms of 2 or more vehicles in household, the demographic groups most similar to Immigrants from Syria are Syrian (56.2%, a difference of 0.010%), Seminole (56.2%, a difference of 0.020%), Venezuelan (56.1%, a difference of 0.050%), Serbian (56.1%, a difference of 0.070%), and Immigrants from Moldova (56.1%, a difference of 0.070%).
| Demographics | Rating | Rank | 2 or more Vehicles in Household |
| Cubans | 84.8 /100 | #137 | Excellent 56.3% |
| Salvadorans | 84.7 /100 | #138 | Excellent 56.3% |
| Armenians | 84.3 /100 | #139 | Excellent 56.3% |
| Latvians | 83.6 /100 | #140 | Excellent 56.2% |
| Immigrants | Cambodia | 83.6 /100 | #141 | Excellent 56.2% |
| South Africans | 83.1 /100 | #142 | Excellent 56.2% |
| Seminole | 81.7 /100 | #143 | Excellent 56.2% |
| Immigrants | Syria | 81.4 /100 | #144 | Excellent 56.2% |
| Syrians | 81.2 /100 | #145 | Excellent 56.2% |
| Venezuelans | 80.7 /100 | #146 | Excellent 56.1% |
| Serbians | 80.3 /100 | #147 | Excellent 56.1% |
| Immigrants | Moldova | 80.2 /100 | #148 | Excellent 56.1% |
| Chileans | 80.2 /100 | #149 | Excellent 56.1% |
| Nicaraguans | 79.9 /100 | #150 | Good 56.1% |
| Immigrants | Northern Europe | 78.7 /100 | #151 | Good 56.1% |
Demographics Similar to Immigrants from Croatia by 2 or more Vehicles in Household
In terms of 2 or more vehicles in household, the demographic groups most similar to Immigrants from Croatia are Immigrants from Honduras (51.8%, a difference of 0.030%), African (51.8%, a difference of 0.040%), Immigrants from Africa (51.8%, a difference of 0.050%), Israeli (51.9%, a difference of 0.090%), and Yuman (51.7%, a difference of 0.12%).
| Demographics | Rating | Rank | 2 or more Vehicles in Household |
| Hondurans | 0.2 /100 | #269 | Tragic 52.0% |
| Immigrants | Ireland | 0.2 /100 | #270 | Tragic 52.0% |
| South Americans | 0.2 /100 | #271 | Tragic 51.9% |
| Sub-Saharan Africans | 0.2 /100 | #272 | Tragic 51.9% |
| Israelis | 0.2 /100 | #273 | Tragic 51.9% |
| Africans | 0.2 /100 | #274 | Tragic 51.8% |
| Immigrants | Honduras | 0.2 /100 | #275 | Tragic 51.8% |
| Immigrants | Croatia | 0.2 /100 | #276 | Tragic 51.8% |
| Immigrants | Africa | 0.2 /100 | #277 | Tragic 51.8% |
| Yuman | 0.1 /100 | #278 | Tragic 51.7% |
| Liberians | 0.1 /100 | #279 | Tragic 51.7% |
| Immigrants | Eastern Europe | 0.1 /100 | #280 | Tragic 51.7% |
| Immigrants | Kazakhstan | 0.1 /100 | #281 | Tragic 51.6% |
| Bahamians | 0.1 /100 | #282 | Tragic 51.5% |
| Immigrants | China | 0.1 /100 | #283 | Tragic 51.5% |