Immigrants from Syria vs Finnish 2 or more Vehicles in Household
COMPARE
Immigrants from Syria
Finnish
2 or more Vehicles in Household
2 or more Vehicles in Household Comparison
Immigrants from Syria
Finns
56.2%
2 OR MORE VEHICLES IN HOUSEHOLD
81.4/ 100
METRIC RATING
144th/ 347
METRIC RANK
60.3%
2 OR MORE VEHICLES IN HOUSEHOLD
100.0/ 100
METRIC RATING
30th/ 347
METRIC RANK
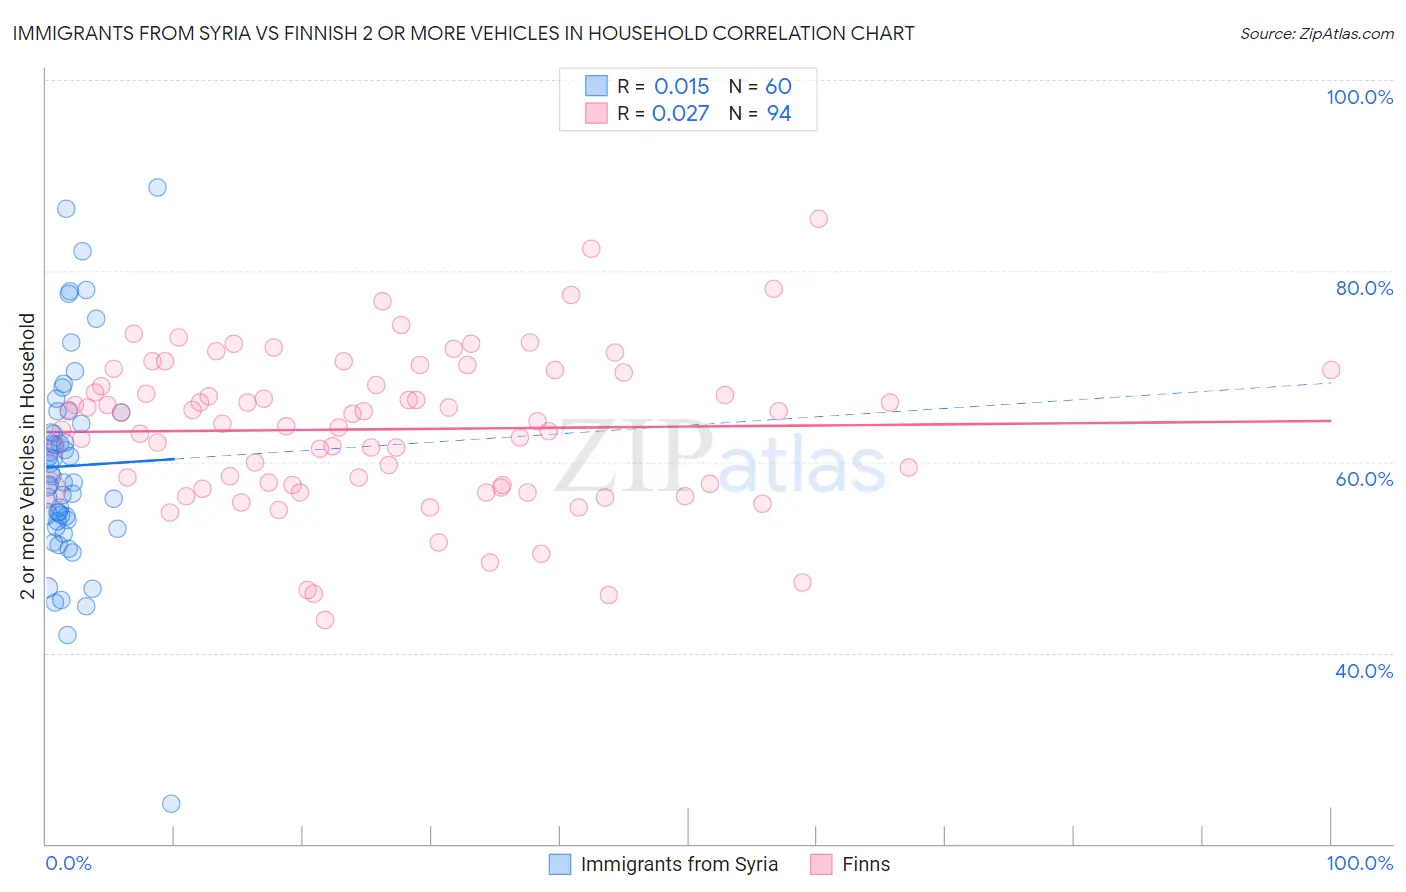
Immigrants from Syria vs Finnish 2 or more Vehicles in Household Correlation Chart
The statistical analysis conducted on geographies consisting of 174,033,758 people shows no correlation between the proportion of Immigrants from Syria and percentage of households with 2 or more vehicles available in the United States with a correlation coefficient (R) of 0.015 and weighted average of 56.2%. Similarly, the statistical analysis conducted on geographies consisting of 404,547,862 people shows no correlation between the proportion of Finns and percentage of households with 2 or more vehicles available in the United States with a correlation coefficient (R) of 0.027 and weighted average of 60.3%, a difference of 7.4%.
2 or more Vehicles in Household Correlation Summary
| Measurement | Immigrants from Syria | Finnish |
| Minimum | 24.2% | 43.4% |
| Maximum | 88.7% | 85.5% |
| Range | 64.5% | 42.1% |
| Mean | 59.6% | 63.4% |
| Median | 58.2% | 64.1% |
| Interquartile 25% (IQ1) | 53.8% | 57.6% |
| Interquartile 75% (IQ3) | 64.6% | 69.4% |
| Interquartile Range (IQR) | 10.8% | 11.8% |
| Standard Deviation (Sample) | 11.0% | 8.0% |
| Standard Deviation (Population) | 10.9% | 8.0% |
Similar Demographics by 2 or more Vehicles in Household
Demographics Similar to Immigrants from Syria by 2 or more Vehicles in Household
In terms of 2 or more vehicles in household, the demographic groups most similar to Immigrants from Syria are Syrian (56.2%, a difference of 0.010%), Seminole (56.2%, a difference of 0.020%), Venezuelan (56.1%, a difference of 0.050%), Serbian (56.1%, a difference of 0.070%), and Immigrants from Moldova (56.1%, a difference of 0.070%).
| Demographics | Rating | Rank | 2 or more Vehicles in Household |
| Cubans | 84.8 /100 | #137 | Excellent 56.3% |
| Salvadorans | 84.7 /100 | #138 | Excellent 56.3% |
| Armenians | 84.3 /100 | #139 | Excellent 56.3% |
| Latvians | 83.6 /100 | #140 | Excellent 56.2% |
| Immigrants | Cambodia | 83.6 /100 | #141 | Excellent 56.2% |
| South Africans | 83.1 /100 | #142 | Excellent 56.2% |
| Seminole | 81.7 /100 | #143 | Excellent 56.2% |
| Immigrants | Syria | 81.4 /100 | #144 | Excellent 56.2% |
| Syrians | 81.2 /100 | #145 | Excellent 56.2% |
| Venezuelans | 80.7 /100 | #146 | Excellent 56.1% |
| Serbians | 80.3 /100 | #147 | Excellent 56.1% |
| Immigrants | Moldova | 80.2 /100 | #148 | Excellent 56.1% |
| Chileans | 80.2 /100 | #149 | Excellent 56.1% |
| Nicaraguans | 79.9 /100 | #150 | Good 56.1% |
| Immigrants | Northern Europe | 78.7 /100 | #151 | Good 56.1% |
Demographics Similar to Finns by 2 or more Vehicles in Household
In terms of 2 or more vehicles in household, the demographic groups most similar to Finns are Spanish American Indian (60.3%, a difference of 0.030%), Hawaiian (60.4%, a difference of 0.13%), Arapaho (60.2%, a difference of 0.13%), Immigrants from Mexico (60.2%, a difference of 0.19%), and Guamanian/Chamorro (60.5%, a difference of 0.24%).
| Demographics | Rating | Rank | 2 or more Vehicles in Household |
| Scotch-Irish | 100.0 /100 | #23 | Exceptional 60.9% |
| Immigrants | Vietnam | 100.0 /100 | #24 | Exceptional 60.9% |
| Whites/Caucasians | 100.0 /100 | #25 | Exceptional 60.8% |
| Welsh | 100.0 /100 | #26 | Exceptional 60.8% |
| Assyrians/Chaldeans/Syriacs | 100.0 /100 | #27 | Exceptional 60.5% |
| Guamanians/Chamorros | 100.0 /100 | #28 | Exceptional 60.5% |
| Hawaiians | 100.0 /100 | #29 | Exceptional 60.4% |
| Finns | 100.0 /100 | #30 | Exceptional 60.3% |
| Spanish American Indians | 100.0 /100 | #31 | Exceptional 60.3% |
| Arapaho | 100.0 /100 | #32 | Exceptional 60.2% |
| Immigrants | Mexico | 100.0 /100 | #33 | Exceptional 60.2% |
| Spanish | 100.0 /100 | #34 | Exceptional 60.2% |
| Immigrants | Philippines | 100.0 /100 | #35 | Exceptional 60.1% |
| Chinese | 100.0 /100 | #36 | Exceptional 60.1% |
| Irish | 100.0 /100 | #37 | Exceptional 60.1% |