Immigrants from Syria vs Immigrants from Poland 2 or more Vehicles in Household
COMPARE
Immigrants from Syria
Immigrants from Poland
2 or more Vehicles in Household
2 or more Vehicles in Household Comparison
Immigrants from Syria
Immigrants from Poland
56.2%
2 OR MORE VEHICLES IN HOUSEHOLD
81.4/ 100
METRIC RATING
144th/ 347
METRIC RANK
54.6%
2 OR MORE VEHICLES IN HOUSEHOLD
19.3/ 100
METRIC RATING
196th/ 347
METRIC RANK
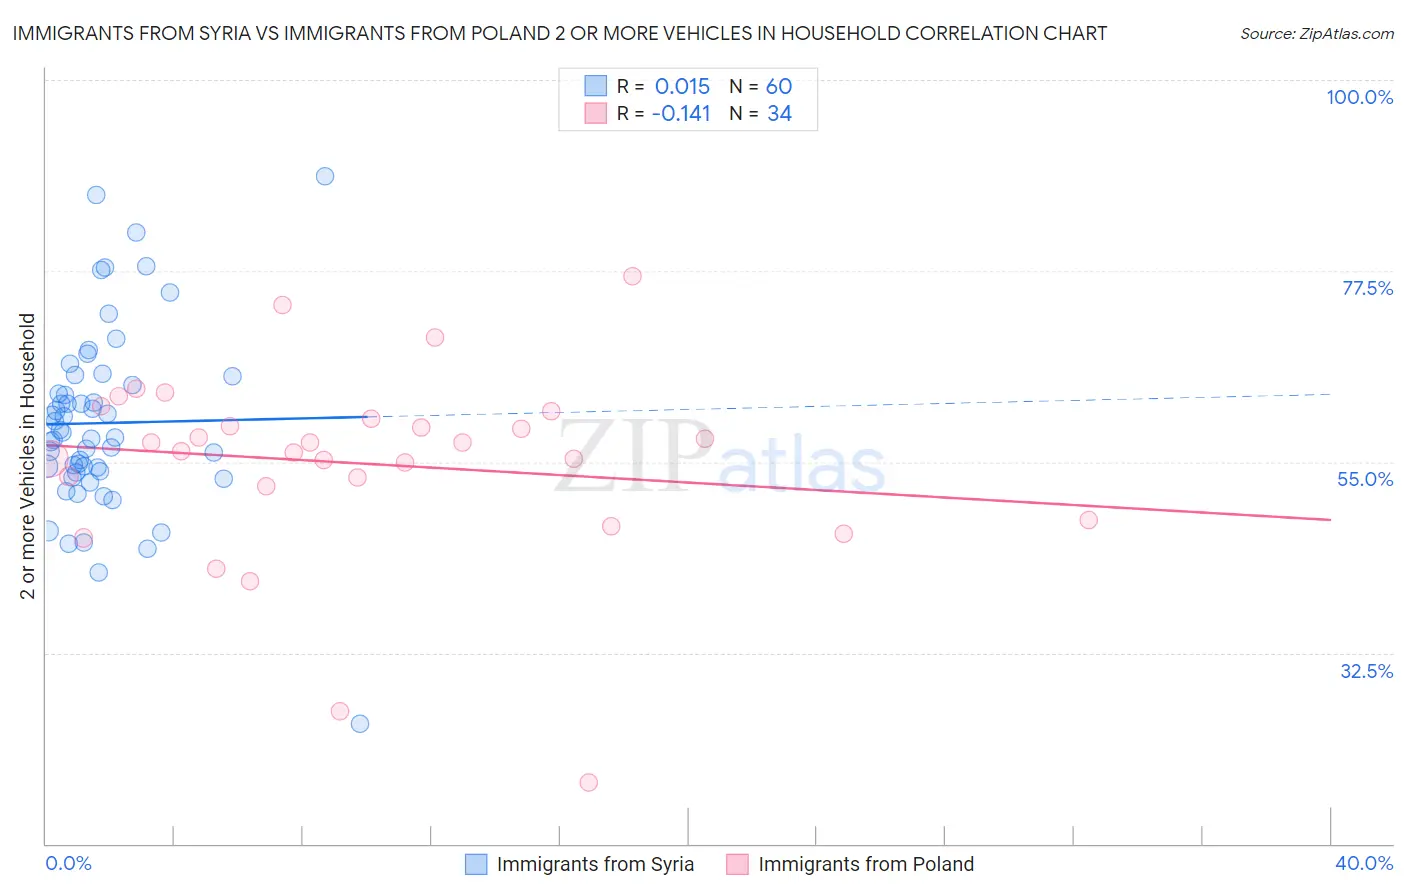
Immigrants from Syria vs Immigrants from Poland 2 or more Vehicles in Household Correlation Chart
The statistical analysis conducted on geographies consisting of 174,033,758 people shows no correlation between the proportion of Immigrants from Syria and percentage of households with 2 or more vehicles available in the United States with a correlation coefficient (R) of 0.015 and weighted average of 56.2%. Similarly, the statistical analysis conducted on geographies consisting of 304,779,004 people shows a poor negative correlation between the proportion of Immigrants from Poland and percentage of households with 2 or more vehicles available in the United States with a correlation coefficient (R) of -0.141 and weighted average of 54.6%, a difference of 2.9%.
2 or more Vehicles in Household Correlation Summary
| Measurement | Immigrants from Syria | Immigrants from Poland |
| Minimum | 24.2% | 17.2% |
| Maximum | 88.7% | 76.9% |
| Range | 64.5% | 59.6% |
| Mean | 59.6% | 54.8% |
| Median | 58.2% | 56.7% |
| Interquartile 25% (IQ1) | 53.8% | 52.2% |
| Interquartile 75% (IQ3) | 64.6% | 60.1% |
| Interquartile Range (IQR) | 10.8% | 8.0% |
| Standard Deviation (Sample) | 11.0% | 11.5% |
| Standard Deviation (Population) | 10.9% | 11.3% |
Similar Demographics by 2 or more Vehicles in Household
Demographics Similar to Immigrants from Syria by 2 or more Vehicles in Household
In terms of 2 or more vehicles in household, the demographic groups most similar to Immigrants from Syria are Syrian (56.2%, a difference of 0.010%), Seminole (56.2%, a difference of 0.020%), Venezuelan (56.1%, a difference of 0.050%), Serbian (56.1%, a difference of 0.070%), and Immigrants from Moldova (56.1%, a difference of 0.070%).
| Demographics | Rating | Rank | 2 or more Vehicles in Household |
| Cubans | 84.8 /100 | #137 | Excellent 56.3% |
| Salvadorans | 84.7 /100 | #138 | Excellent 56.3% |
| Armenians | 84.3 /100 | #139 | Excellent 56.3% |
| Latvians | 83.6 /100 | #140 | Excellent 56.2% |
| Immigrants | Cambodia | 83.6 /100 | #141 | Excellent 56.2% |
| South Africans | 83.1 /100 | #142 | Excellent 56.2% |
| Seminole | 81.7 /100 | #143 | Excellent 56.2% |
| Immigrants | Syria | 81.4 /100 | #144 | Excellent 56.2% |
| Syrians | 81.2 /100 | #145 | Excellent 56.2% |
| Venezuelans | 80.7 /100 | #146 | Excellent 56.1% |
| Serbians | 80.3 /100 | #147 | Excellent 56.1% |
| Immigrants | Moldova | 80.2 /100 | #148 | Excellent 56.1% |
| Chileans | 80.2 /100 | #149 | Excellent 56.1% |
| Nicaraguans | 79.9 /100 | #150 | Good 56.1% |
| Immigrants | Northern Europe | 78.7 /100 | #151 | Good 56.1% |
Demographics Similar to Immigrants from Poland by 2 or more Vehicles in Household
In terms of 2 or more vehicles in household, the demographic groups most similar to Immigrants from Poland are Argentinean (54.5%, a difference of 0.12%), Iroquois (54.7%, a difference of 0.20%), Carpatho Rusyn (54.4%, a difference of 0.21%), Central American (54.7%, a difference of 0.22%), and Immigrants from Norway (54.4%, a difference of 0.24%).
| Demographics | Rating | Rank | 2 or more Vehicles in Household |
| Eastern Europeans | 27.5 /100 | #189 | Fair 54.8% |
| Russians | 26.3 /100 | #190 | Fair 54.8% |
| Immigrants | Immigrants | 25.0 /100 | #191 | Fair 54.7% |
| Immigrants | Romania | 23.8 /100 | #192 | Fair 54.7% |
| Immigrants | Japan | 23.4 /100 | #193 | Fair 54.7% |
| Central Americans | 23.0 /100 | #194 | Fair 54.7% |
| Iroquois | 22.6 /100 | #195 | Fair 54.7% |
| Immigrants | Poland | 19.3 /100 | #196 | Poor 54.6% |
| Argentineans | 17.5 /100 | #197 | Poor 54.5% |
| Carpatho Rusyns | 16.2 /100 | #198 | Poor 54.4% |
| Immigrants | Norway | 15.9 /100 | #199 | Poor 54.4% |
| Houma | 15.8 /100 | #200 | Poor 54.4% |
| Immigrants | Italy | 15.5 /100 | #201 | Poor 54.4% |
| Immigrants | North Macedonia | 14.9 /100 | #202 | Poor 54.4% |
| Immigrants | Peru | 14.3 /100 | #203 | Poor 54.4% |