Immigrants from Syria vs Soviet Union 2 or more Vehicles in Household
COMPARE
Immigrants from Syria
Soviet Union
2 or more Vehicles in Household
2 or more Vehicles in Household Comparison
Immigrants from Syria
Soviet Union
56.2%
2 OR MORE VEHICLES IN HOUSEHOLD
81.4/ 100
METRIC RATING
144th/ 347
METRIC RANK
45.7%
2 OR MORE VEHICLES IN HOUSEHOLD
0.0/ 100
METRIC RATING
320th/ 347
METRIC RANK
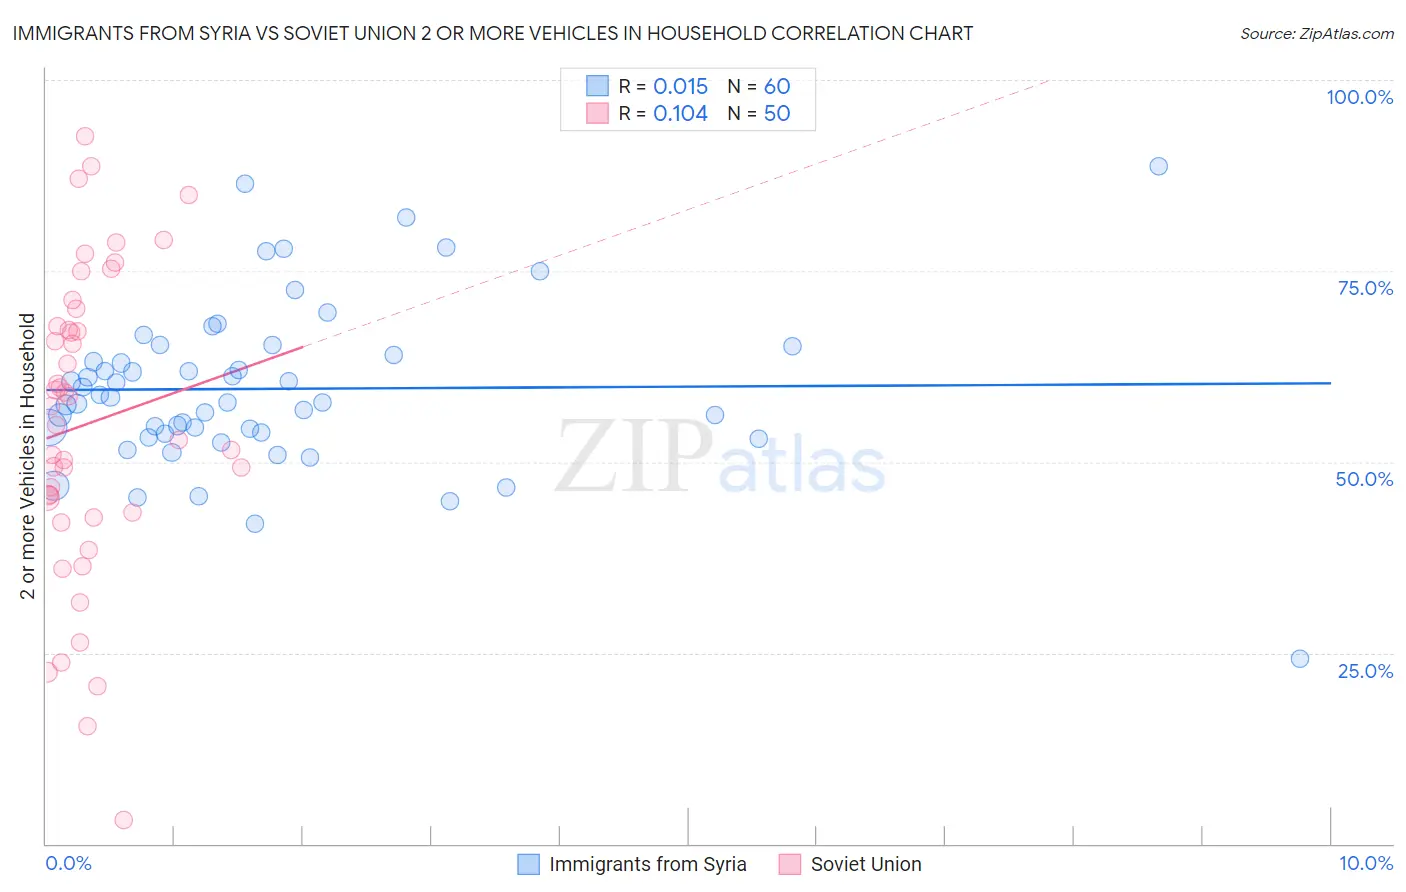
Immigrants from Syria vs Soviet Union 2 or more Vehicles in Household Correlation Chart
The statistical analysis conducted on geographies consisting of 174,033,758 people shows no correlation between the proportion of Immigrants from Syria and percentage of households with 2 or more vehicles available in the United States with a correlation coefficient (R) of 0.015 and weighted average of 56.2%. Similarly, the statistical analysis conducted on geographies consisting of 43,509,630 people shows a poor positive correlation between the proportion of Soviet Union and percentage of households with 2 or more vehicles available in the United States with a correlation coefficient (R) of 0.104 and weighted average of 45.7%, a difference of 22.8%.
2 or more Vehicles in Household Correlation Summary
| Measurement | Immigrants from Syria | Soviet Union |
| Minimum | 24.2% | 3.0% |
| Maximum | 88.7% | 92.6% |
| Range | 64.5% | 89.6% |
| Mean | 59.6% | 54.9% |
| Median | 58.2% | 56.1% |
| Interquartile 25% (IQ1) | 53.8% | 43.4% |
| Interquartile 75% (IQ3) | 64.6% | 67.8% |
| Interquartile Range (IQR) | 10.8% | 24.4% |
| Standard Deviation (Sample) | 11.0% | 20.0% |
| Standard Deviation (Population) | 10.9% | 19.8% |
Similar Demographics by 2 or more Vehicles in Household
Demographics Similar to Immigrants from Syria by 2 or more Vehicles in Household
In terms of 2 or more vehicles in household, the demographic groups most similar to Immigrants from Syria are Syrian (56.2%, a difference of 0.010%), Seminole (56.2%, a difference of 0.020%), Venezuelan (56.1%, a difference of 0.050%), Serbian (56.1%, a difference of 0.070%), and Immigrants from Moldova (56.1%, a difference of 0.070%).
| Demographics | Rating | Rank | 2 or more Vehicles in Household |
| Cubans | 84.8 /100 | #137 | Excellent 56.3% |
| Salvadorans | 84.7 /100 | #138 | Excellent 56.3% |
| Armenians | 84.3 /100 | #139 | Excellent 56.3% |
| Latvians | 83.6 /100 | #140 | Excellent 56.2% |
| Immigrants | Cambodia | 83.6 /100 | #141 | Excellent 56.2% |
| South Africans | 83.1 /100 | #142 | Excellent 56.2% |
| Seminole | 81.7 /100 | #143 | Excellent 56.2% |
| Immigrants | Syria | 81.4 /100 | #144 | Excellent 56.2% |
| Syrians | 81.2 /100 | #145 | Excellent 56.2% |
| Venezuelans | 80.7 /100 | #146 | Excellent 56.1% |
| Serbians | 80.3 /100 | #147 | Excellent 56.1% |
| Immigrants | Moldova | 80.2 /100 | #148 | Excellent 56.1% |
| Chileans | 80.2 /100 | #149 | Excellent 56.1% |
| Nicaraguans | 79.9 /100 | #150 | Good 56.1% |
| Immigrants | Northern Europe | 78.7 /100 | #151 | Good 56.1% |
Demographics Similar to Soviet Union by 2 or more Vehicles in Household
In terms of 2 or more vehicles in household, the demographic groups most similar to Soviet Union are Jamaican (45.8%, a difference of 0.060%), Immigrants from Albania (46.0%, a difference of 0.58%), Immigrants from Haiti (46.5%, a difference of 1.7%), Cape Verdean (46.8%, a difference of 2.3%), and Immigrants from Jamaica (44.5%, a difference of 2.9%).
| Demographics | Rating | Rank | 2 or more Vehicles in Household |
| U.S. Virgin Islanders | 0.0 /100 | #313 | Tragic 47.5% |
| Immigrants | Ghana | 0.0 /100 | #314 | Tragic 47.4% |
| Puerto Ricans | 0.0 /100 | #315 | Tragic 47.1% |
| Cape Verdeans | 0.0 /100 | #316 | Tragic 46.8% |
| Immigrants | Haiti | 0.0 /100 | #317 | Tragic 46.5% |
| Immigrants | Albania | 0.0 /100 | #318 | Tragic 46.0% |
| Jamaicans | 0.0 /100 | #319 | Tragic 45.8% |
| Soviet Union | 0.0 /100 | #320 | Tragic 45.7% |
| Immigrants | Jamaica | 0.0 /100 | #321 | Tragic 44.5% |
| Senegalese | 0.0 /100 | #322 | Tragic 44.2% |
| Immigrants | Caribbean | 0.0 /100 | #323 | Tragic 44.2% |
| Immigrants | Cabo Verde | 0.0 /100 | #324 | Tragic 43.3% |
| Immigrants | West Indies | 0.0 /100 | #325 | Tragic 43.1% |
| Immigrants | Senegal | 0.0 /100 | #326 | Tragic 43.0% |
| Immigrants | Yemen | 0.0 /100 | #327 | Tragic 42.8% |